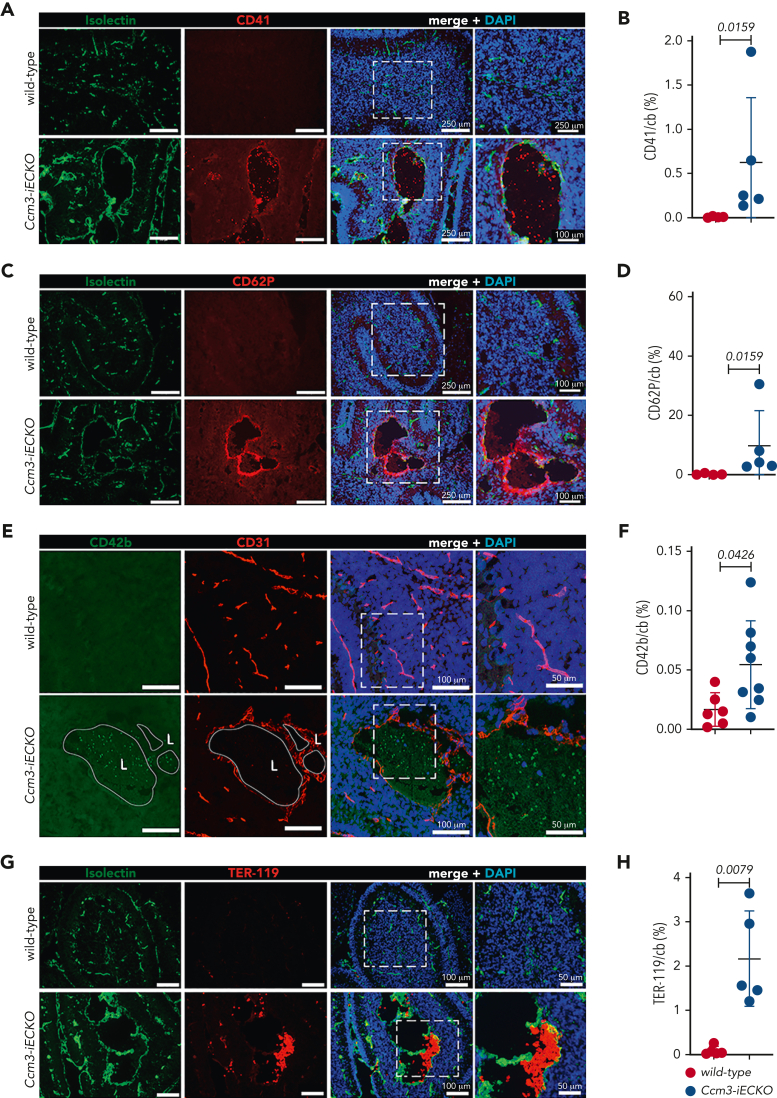
Figure 4.
The endothelium of Ccm3-iECKO mice is activated and procoagulant. (A) Representative images of the cerebellum of wild-type (upper panel) and Ccm3-iECKO (lower panel) P8 mice stained with isolectin (green), CD41 (red), and DAPI (blue). A magnified image is shown in the right panel. (B) Quantification of CD41 in the cerebellum (cb) of wild-type and Ccm3-iECKO mice (P = .0159). (C) Representative images of the cerebellum of wild-type (upper panel) and Ccm3-iECKO (lower panel) P8 mice stained with isolectin (green), CD62P (red), and DAPI (blue). A magnified image is shown in the right panel. (D) Quantification of CD62P in the cerebellum (cb) of wild-type and Ccm3-iECKO mice (P = .0159). (E) Representative images of the cerebellum of wild-type (upper panel) and Ccm3-iECKO (lower panel) P8 mice stained with CD42b (green), CD31 (red), and DAPI (blue). A magnified image is shown in the right panel. (F) Quantification of CD42b area in the cerebellum (cb) of wild-type and Ccm3-iECKO mice (P = .0426). (G) Representative images of the cerebellum of wild-type (upper panel) and Ccm3-iECKO (lower panel) P8 mice stained with isolectin (green), TER-119 (red), and DAPI (blue). Merged image (left panel) shows TER-119-positive cells attached to the vessel wall in Ccm3-iECKO mice. (H) Quantification of TER-119 in the cerebellum (cb) of wild-type and Ccm3-iECKO mice (P = .0079). In all graphs, each data point represents 1 biological replicate (n = 4-8 mice per group), the bar indicates the mean of each group, and the error bars represent the standard deviation. A Mann-Whitney U test was used to compare wild-type mice with Ccm3-iECKO mice; the corresponding P values are indicated on each graph.

