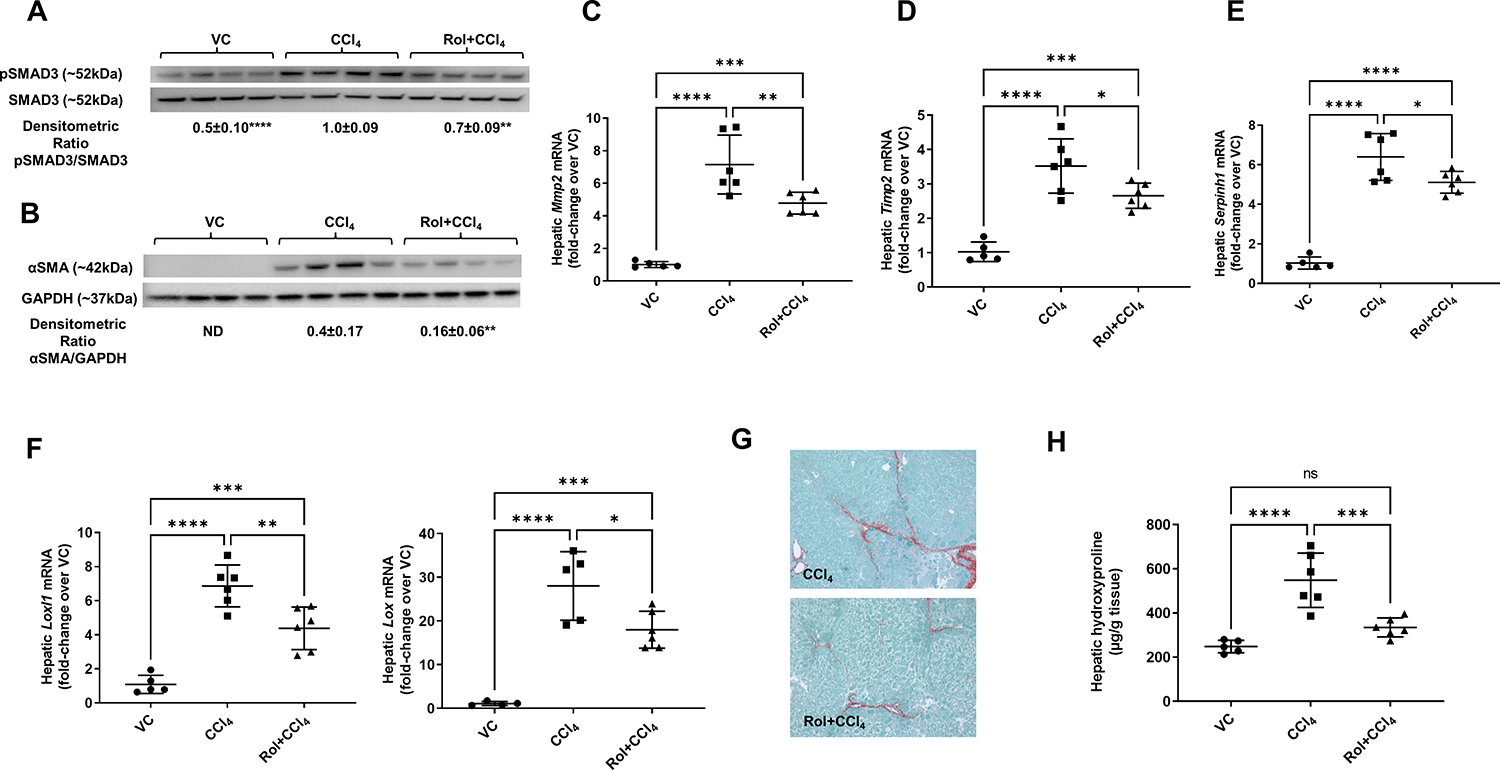
Figure 2. Decreased fibrogenesis and collagen deposition in mice treated with a PDE4 inhibitor, rolipram.

(A) pSMAD3 and (B) αSMA protein levels. Western blot, SMAD3 and GAPDH are loading controls, densitometric ratios are shown. (C) Hepatic mRNA levels of Mmp2, (D) Timp2, (E) Serpinh1 (Hsp47), (F) Loxl1 and Lox. (G) Collagen deposition, Sirius red staining and (H) Hydroxyproline levels. One-way ANOVA with Tukey’s post hoc test, *p<0.05, **p<0.01, ***p<0.001, ****p<0.0001.
