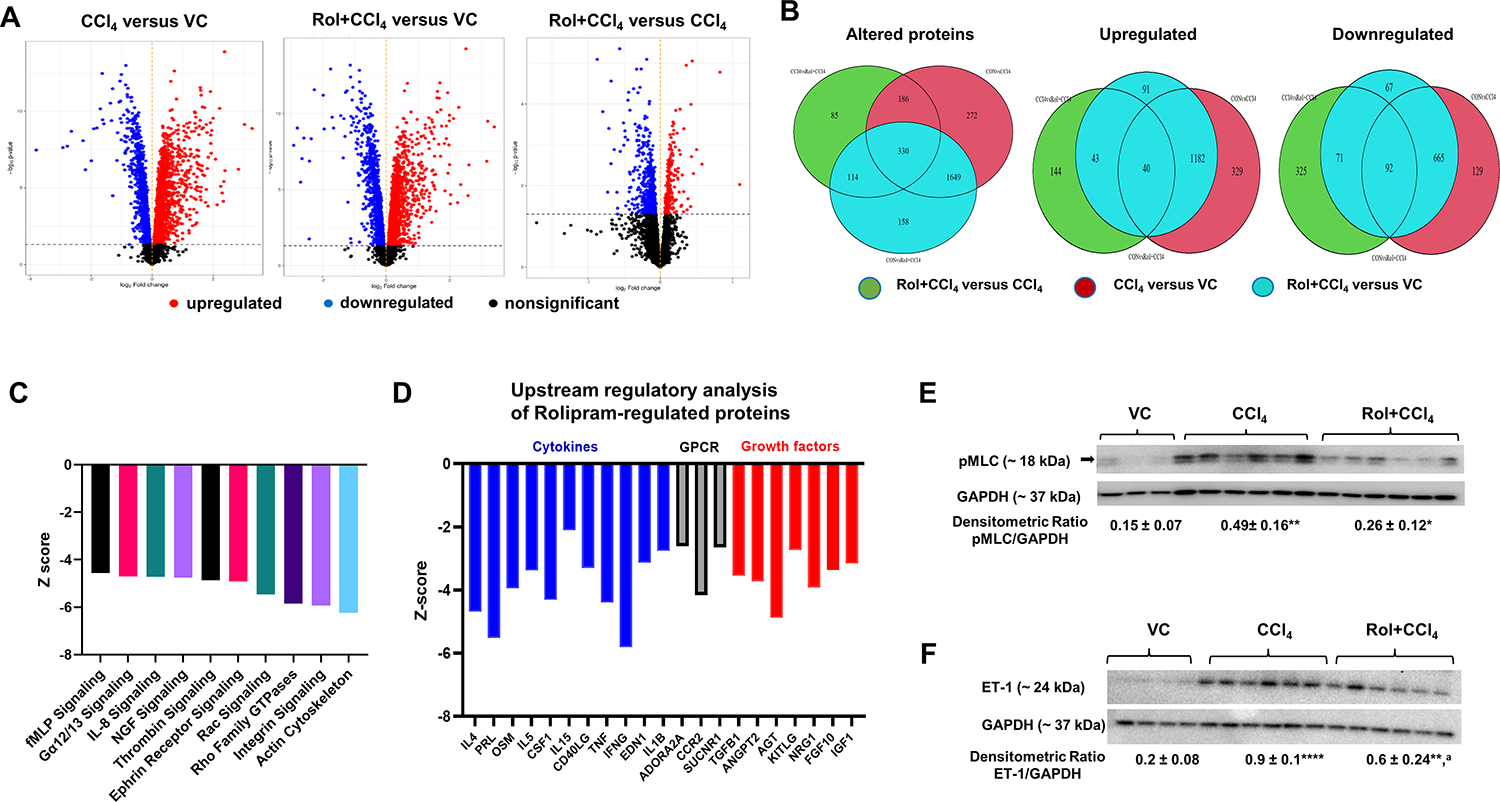
Figure 3. Proteomic analysis of differentially expressed proteins between experimental groups.

(A) Volcano Plot. Proteins are plotted as -log10(P-value) versus log2 Fold-Change. (B) Venn diagrams showing common and unique altered proteins between experimental groups. (C) Top 10 pathways downregulated by rolipram, (D) upstream regulatory analysis of rolipram-regulated proteins, (E) Western blot for liver pMLC and (F) Endothelin 1 (ET-1). VC – vehicle control, CCl4 – carbon tetrachloride, Rol+CCl4 – Rolipram-cotreated CCl4 mice. GAPDH – loading control. One-way ANOVA with Tukey’s post hoc test, *p<0.05, **p<0.01, ****p<0.0001 compared to vehicle control group (VC), ap<0.05 compared to CCl4.
