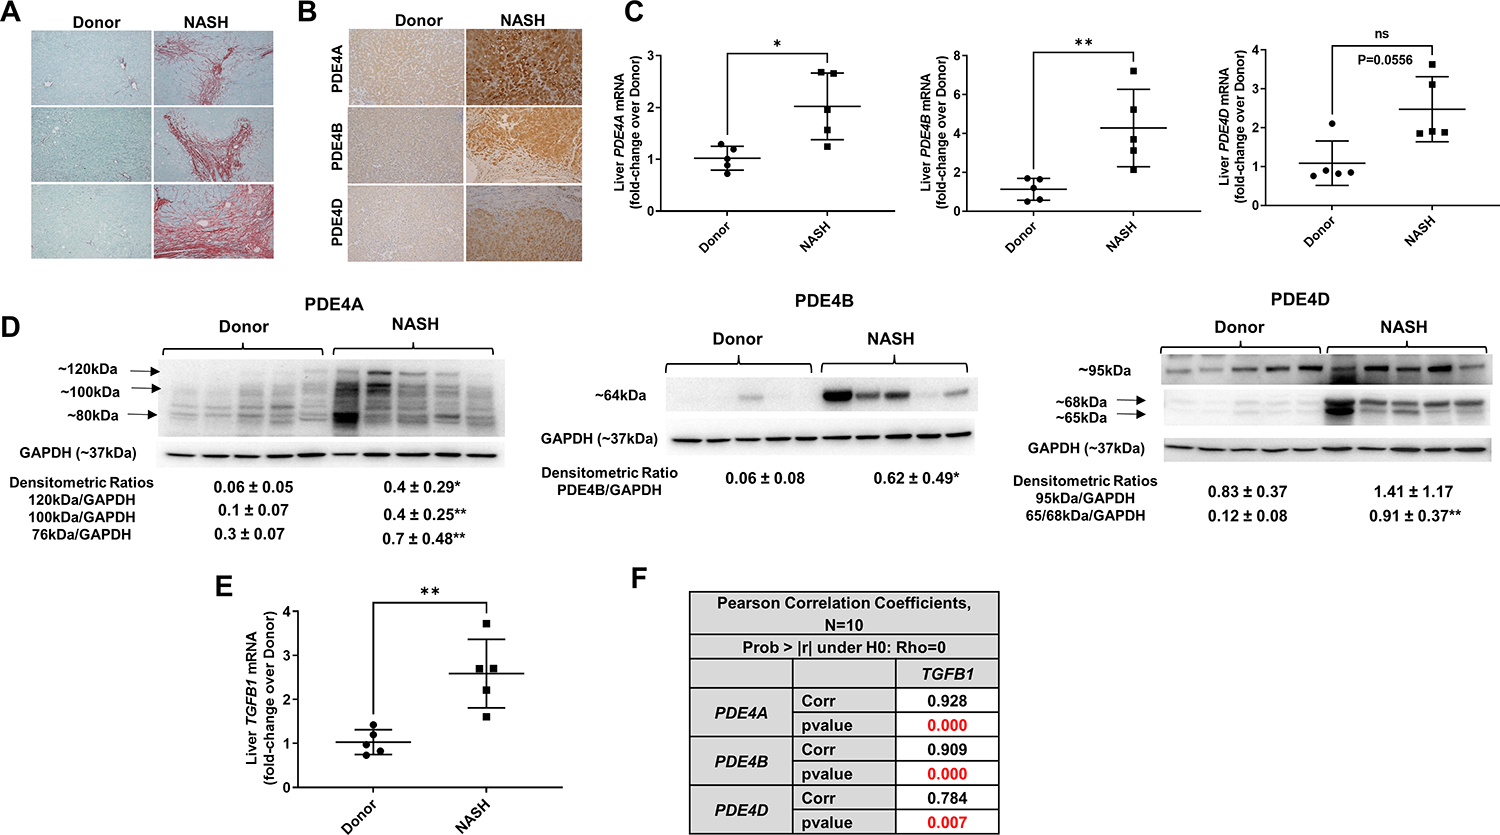
Figure 4. Increased PDE4 expression in NASH patient livers strongly correlates with TGFβ1.

(A) representative images of Sirius red staining documenting a significant collagen deposition in livers of NASH patients. Original magnification 10x. (B) Increased PDE4A, B and D protein immunostaining in NASH livers, magnification 10x. (C) Liver PDE4A, B and D mRNA. (D) Liver PDE4A, B and D protein levels by Western blot, densitometric ratios to GAPDH- loading control are shown (from top to bottom bands). E. Liver TGFB1 mRNA, (F) Pearson correlation analysis shows a positive strong correlation of TGFβ1 with PDE4. The P values were computed using t-statistic under , where is the correlation coefficient. *p<0.05, **p<0.01.
