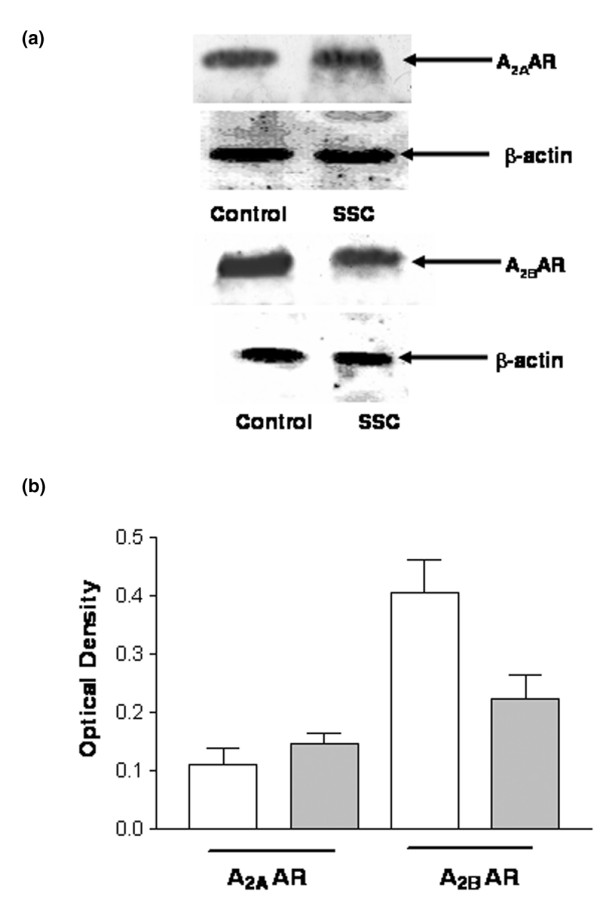
Figure 1.

Immunoblotting analysis of A2A and A2B adenosine receptors (ARs) from systemic sclerosis (SSc) neutrophils and controls. Cells obtained from 26 healthy volunteers and 26 SSc patients were lysed as described in the Methods section. Equal amounts of protein (50 μg) were separated on polyacrylamide gel, blotted and probed with 0.1 μg/ml rabbit anti-human A2A AR or A2B AR antibodies. Immunoreactive bands were visualized according to electrogenerated chemiluminescence protocol. A2A and A2B AR antibodies recognized immunoreactive bands of 45 kDa and 50 kDa, respectively. (a) Representative experiment performed on neutrophils from one healthy volunteer and one SSc patient. (b) Densitometric analysis of A2A and A2B AR immunoreactive bands from 26 healthy volunteers and 26 SSc patients. Graph bars: mean ± standard error of band density, normalized to β-actin. White bars are controls; grey bars are SSc patients.
