
Figure 3.
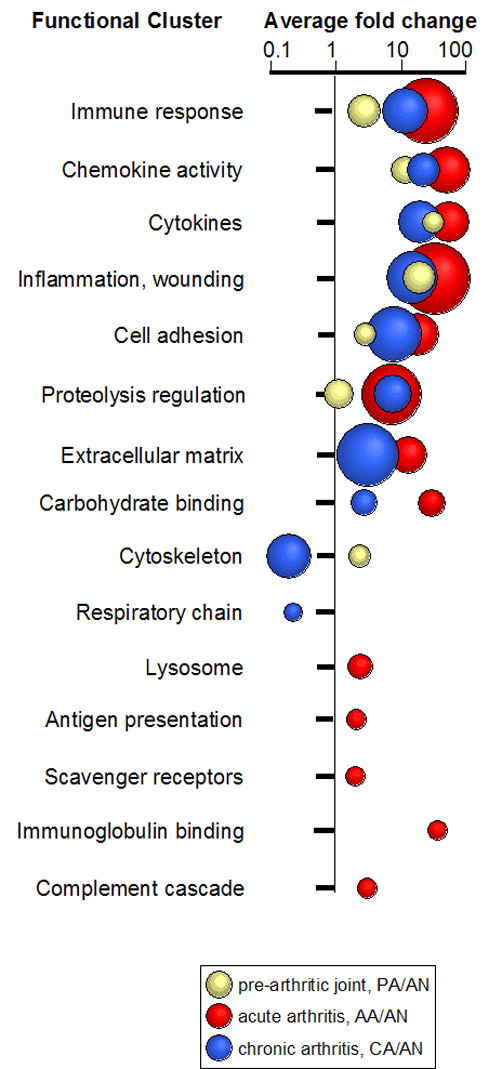
Gene activities at different phases of arthritis progression. All clusters identified in pre-inflamed joints (PA/AN comparison, yellow circles), acute arthritis (AA/AN, red circles), and chronic arthritic paws (CA/AN, blue circles) are indicated by the number of genes in the cluster (circle diameter represents cluster size) and the average fold change of gene expression (logarithmic horizontal scale). The size of the cluster varies from 3 genes ('complement cascade' cluster) in pre-inflamed joints to 51 genes ('immune response' cluster) in acute arthritis. AN, normal paws of naive BALB/cSCID mice; PA, clinically normal pre-arthritic paws; AA, acutely arthritic paws; CA, chronically inflamed paws.