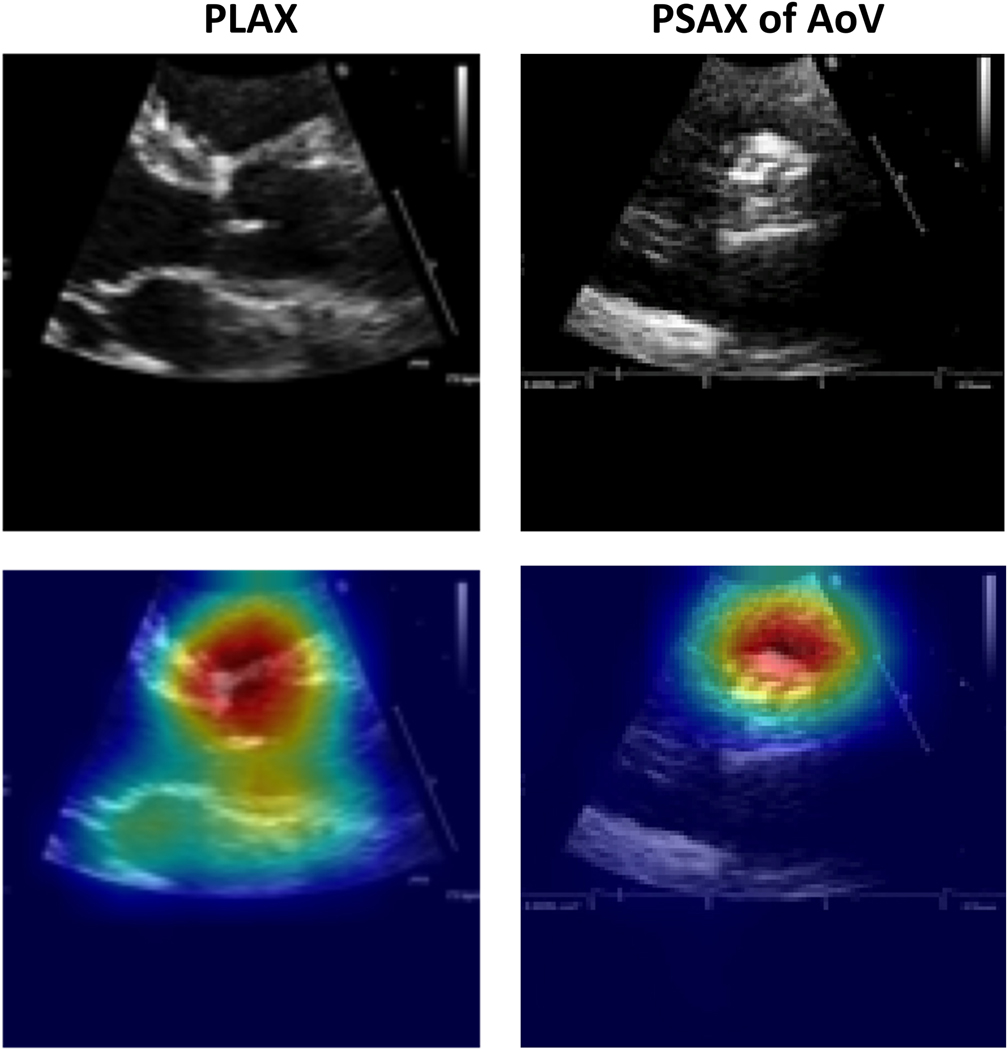
Figure 2.
Grad-CAM visualizations of view predictions. Examples of PLAX (left) and PSAX AoV-level (right) views in our test set and their Grad-CAM visualizations. The original image is shown at the top, and the corresponding Grad-CAM visualization is shown below (original image with heat map overlay). The model correctly predicted the images to be PLAX and PSAX views, respectively, and correctly focused on the relevant region of the heart for making the predictions. The hotter the color, the more important the pixel in making the class discriminative decisions.

