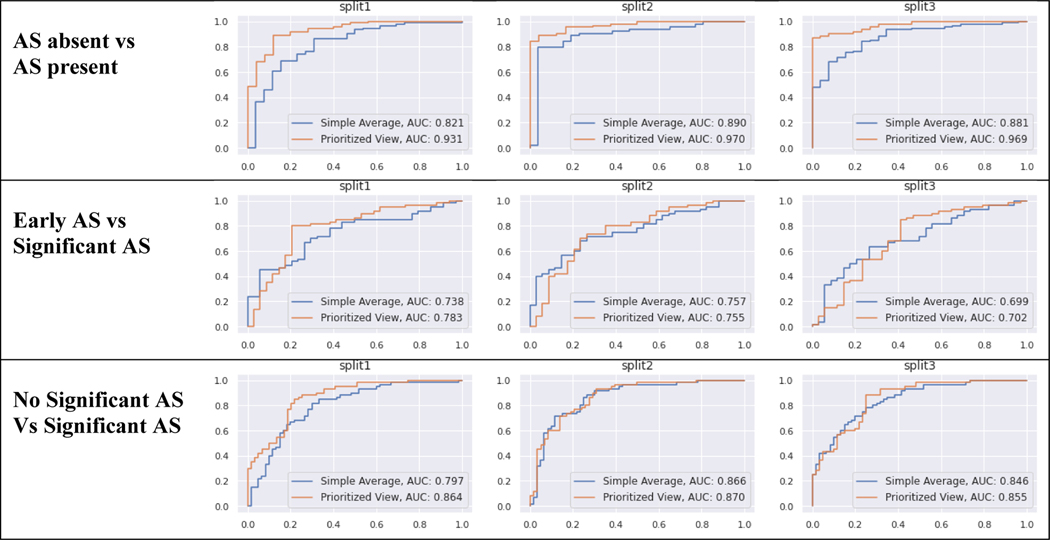
Figure 3. Diagnostic Classification Receiver Operator Curves.
Each set of experiments was run with 3 random training-validation-test splits of the data (labeled split1, split2, split3). The top row represents screening for AS: AS absent vs AS present (any severity). Middle row represents early AS (mild, mild/moderate) vs significant AS (moderate, severe). Bottom row represents non-significant AS (none, mild, mild/moderate) vs significant AS (moderate, severe). Each line gives the performance of one prediction strategy for aggregating across all images in a study: Prioritized View and Simple Average. Each column shows the results for one partition of the TMED-2 data into training/test.

