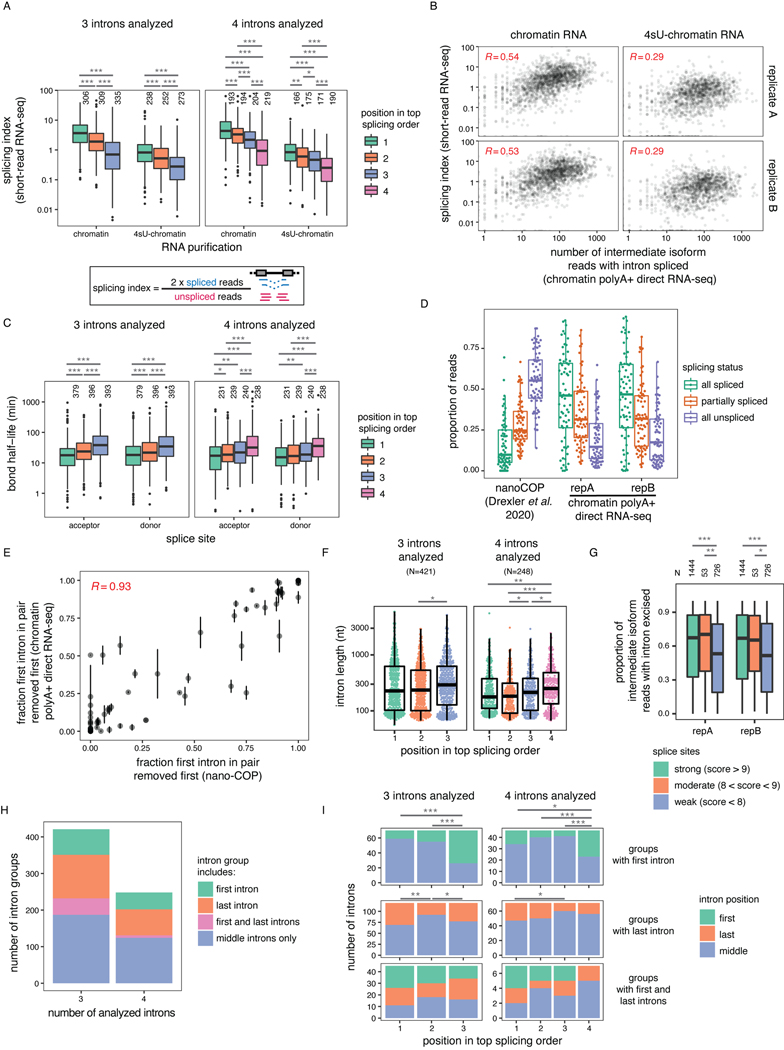
Extended Data Figure 4.
(related to Figure 2). A) Splicing index from short-read RNA-seq of rRNA-depleted nascent RNA, as a function of the position of introns in the top ranked splicing order from chromatin polyA+ dRNA-seq. B) Correlation between splicing index from A) and the number of intermediate isoform reads with a given intron excised from chromatin polyA+ dRNA-seq. Each dot represents one intron included in splicing order analyses in K562 cells. Pearson’s correlation coefficient is shown on the plot [p-value < 0.0001, 95% confidence interval 0.50–0.57 (repA chromatin), 0.50–0.56 (repB chromatin), 0.24–0.34 (repA 4sU-chromatin and repB 4sU-chromatin)]. C) Acceptor and donor bond half-lives25 as a function of the position of introns in the top ranked splicing order from chromatin polyA+ dRNA-seq. D) Splicing status of reads mapping to the intron pairs (N=69) compared between nano-COP14 and polyA+ dRNA-seq in E. E) Splicing order for pairs of consecutive introns in nano-COP vs. polyA+ dRNA-seq. Vertical bars show the range between the two biological replicates for chromatin polyA+ dRNA-seq. Pearson’s correlation coefficient is shown on the plot (p-value < 0.0001, 95% confidence interval 0.88–0.95). F) Intron length as a function of the position of introns in the top ranked splicing order per intron group. G) Proportion of intermediate isoform reads with a given intron excised for introns with strong, moderate or weak splice sites. H) Number of intron groups used in splicing order analyses that include a first or last intron in a transcript or both. I) Number of introns that are first or last in a transcript as a function of their position in the top ranked splicing order. For A), C), F) and G), introns or groups were compared using a two-sided Wilcoxon rank-sum test. For I), groups were compared using a two-sided Fisher’s exact test. *: p-value < 0.05, **: p-value < 0.01, ***: p-value < 0.001. In A), C), D), F) and G, boxplots elements are shown as follows: center line, median; box limits, upper and lower quartiles; whiskers, 1.5x interquartile range. For A), C) and G), points represent outliers.

