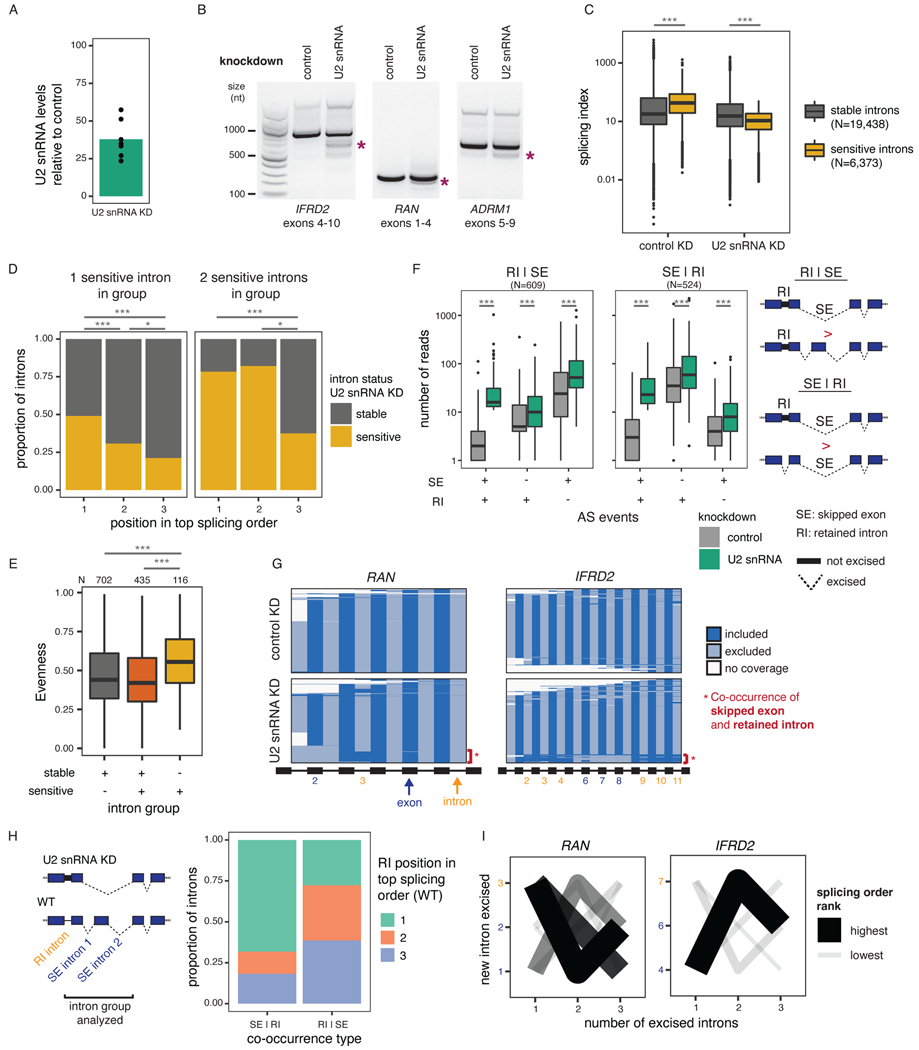
Figure 5. Splicing order changes upon U2 snRNA-mediated exon skipping.
A) qRT-PCR showing reduced U2 snRNA levels relative to control after a 48 hour KD. B) Agarose gel electrophoresis of RT-PCR products showing alternative splicing events upon U2 snRNA KD (asterisks). C) Distribution of total RNA splicing index for stable sensitive introns upon U2 snRNA KDThe average across biological triplicates was used for each intron. D) Proportion of introns that are sensitive or stable upon U2 snRNA knockdown as a function of their position in the top ranked splicing order in WT HeLa cells. Groups were compared using a two-sided Fisher’s exact test.E) Evenness for splicing orders in HeLa WT cells for intron groups that contain stable introns, sensitive introns, or both. . F) Distribution of the number of reads with skipped exons (SE), retained introns (RI), both, or neither. Intron groups are separated based on whether they show “SE | RI” or “RI | SE” upon U2 snRNA KD, as depicted next to the plot. G) Representation of all reads mapping to RAN and IFRD2 upon dRNA-seq of total poly(A)-selected RNA from control or U2 snRNA KD. Each line represents one read and each column represents an intron or an exon. RIs and SEs in the U2 snRNA KD are shown as yellow or dark blue numbers, respectively. H) Proportion of introns retained upon U2 snRNA knockdown as a function of their position in the top ranked splicing order in WT HeLa cells, for intron groups composed of one intron involved in intron retention and two introns involved in exon skipping. I) Splicing order plots for RAN and IFRD2 in WT HeLa cells, for groups containing introns involved in exon skipping (dark blue font) and intron retention (orange font) upon U2 snRNA KD. In C), E) and F), boxplots elements are shown as follows: center line, median; box limits, upper and lower quartiles; whiskers, 1.5x interquartile range; points, outliers. In D), E) and F), groups were compared using a two-sided Wilcoxon rank-sum test. *: p-value < 0.05; ***: p-value < 0.001.

