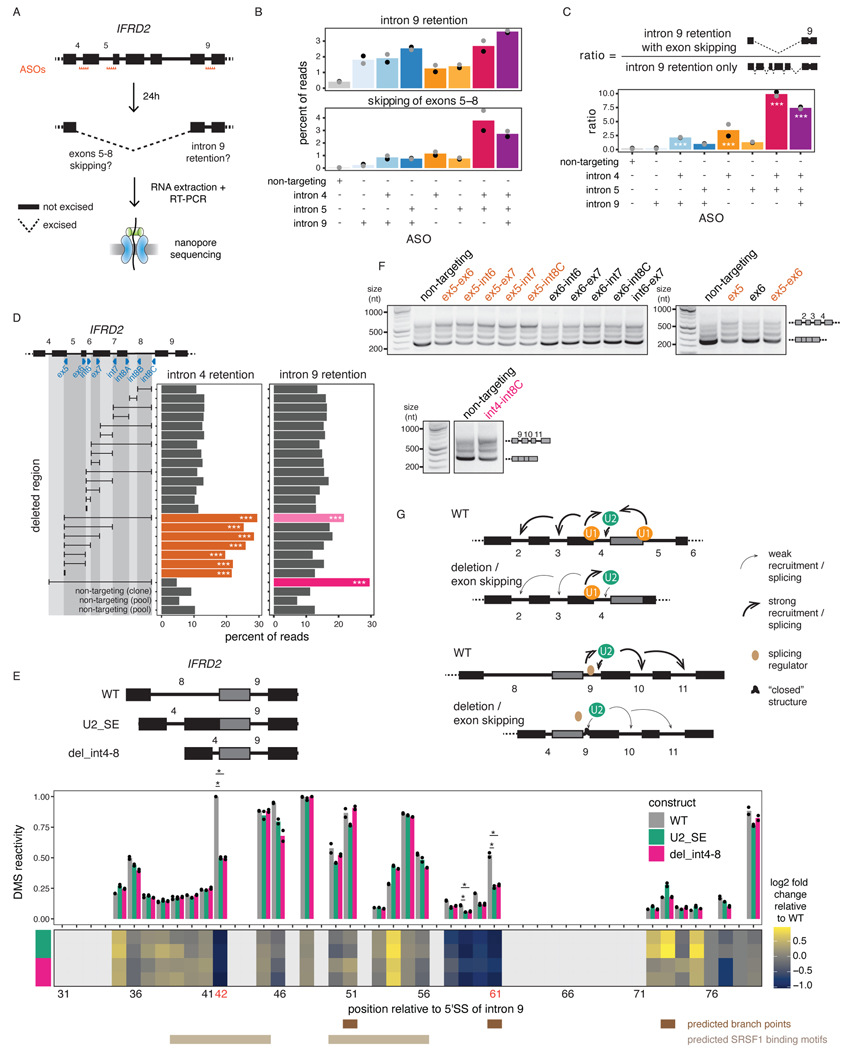
Figure 6. Perturbation of one intron disrupts excision of proximal introns.
A) Schematic of the experimental design for B) and C), adapted from 14. B) Levels of intron 9 retention or exons 5–8 skipping upon treatment with ASO(s) targeting IFRD2. Dots indicate biological replicates. Each ASO treatment was compared to the control using a two-sided Fisher’s exact test (p-value < 10−16 for all comparisons). C) Ratio of the number of reads with intron 9 retention and exons 5–8 skipping relative to the number of reads with intron 9 retention only upon treatment with ASO(s) targeting IFRD2. Dots indicate biological replicates. A one-sided binomial test was used to determine whether intron 9 retention occurs more frequently with exon skipping than expected by chance. ***: p-value < 0.001 and ratio >= 2. D) Percent of reads showing intron 4 or 9 retention upon deletion tiling of IFRD2 using CRISPR-Cas9 editing. Deletions are shown as a black horizontal line delimited by vertical lines aligned to the sgRNA(s) used (blue triangles). A one-sided binomial test was used to compare the frequency of intron retention in each deletion relative to the mean frequency across non-targeting controls. ***: p-value < 0.001 and fold change >= 2. E) Top: In vitro transcribed RNAs used for DMS-MaPseq. Middle: DMS-MaPseq reactivity for nucleotides 30 to 80 of IFRD2 intron 9. Individual dots represent two biological replicates. Bottom: Heatmap showing the log2 fold change of DMS reactivity in U2_SE or del_int4–8 relative to WT. Positions corresponding to G’s and T’s are shown in light grey. Positions where the largest fold change is observed in both mutated constructs are shown in orange font. Predicted branch points46,60 and the two predicted SRSF1 binding sites (ESEFinder47) with the highest scores are shown. Reactivities were compared with a two-sided Student’s t-test. *: p-value < 0.05 and fold change relative to WT >= 2. F) Agarose gel electrophoresis showing the RT-PCR products from amplification of introns 2 to 4 of IFRD2. Deletions involving the end of exon 5 are shown in orange font. G) Working models for the two mechanisms regulating excision of introns 4 and 9.

