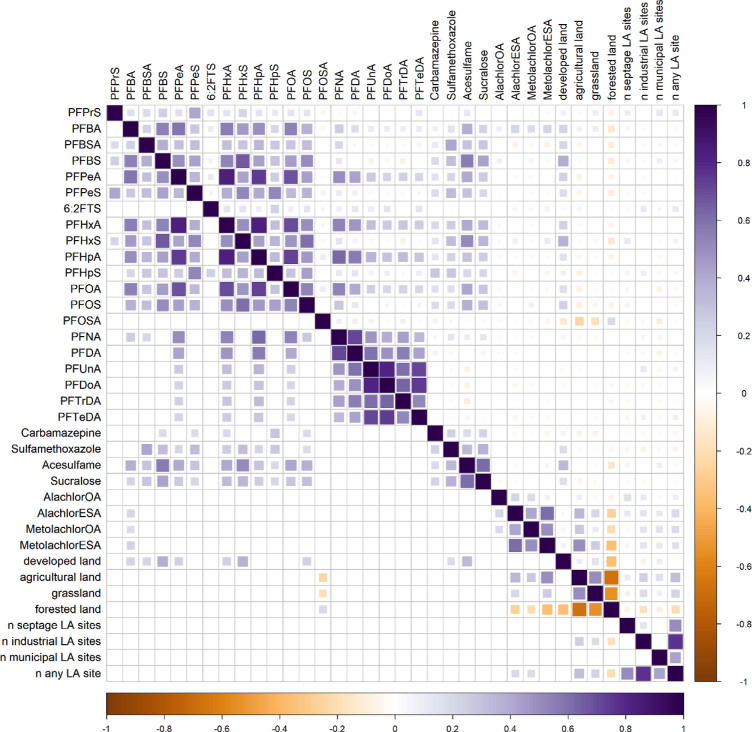
Figure 4.
Correlation plot with intensity and amount of color indicating the value of the Spearman correlation coefficient (ρ) between variable pairs. The upper-right triangle shows all correlation values, regardless of p-values, while the lower-left triangle shows colored squares only for significant correlations (Holm sequentially adjusted p < 0.05).

