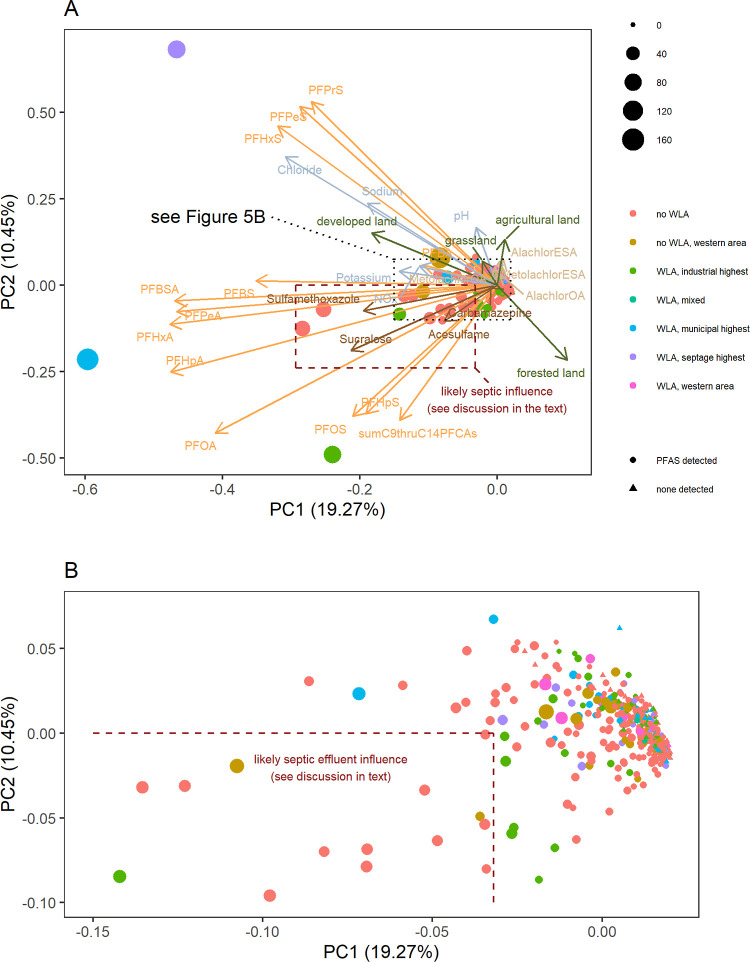
Figure 5.
Principal component analysis plots for all samples (A) and zoomed in on a smaller area (B), which is indicated by the block dotted rectangle on (A). Symbol shape indicates whether PFAS were detected, and symbol size is proportional to the sum of detected PFAS. Colors of symbols indicate if waste land application (WLA) has been permitted nearby and also indicate which samples are located in the western area with higher PFBA concentrations.

