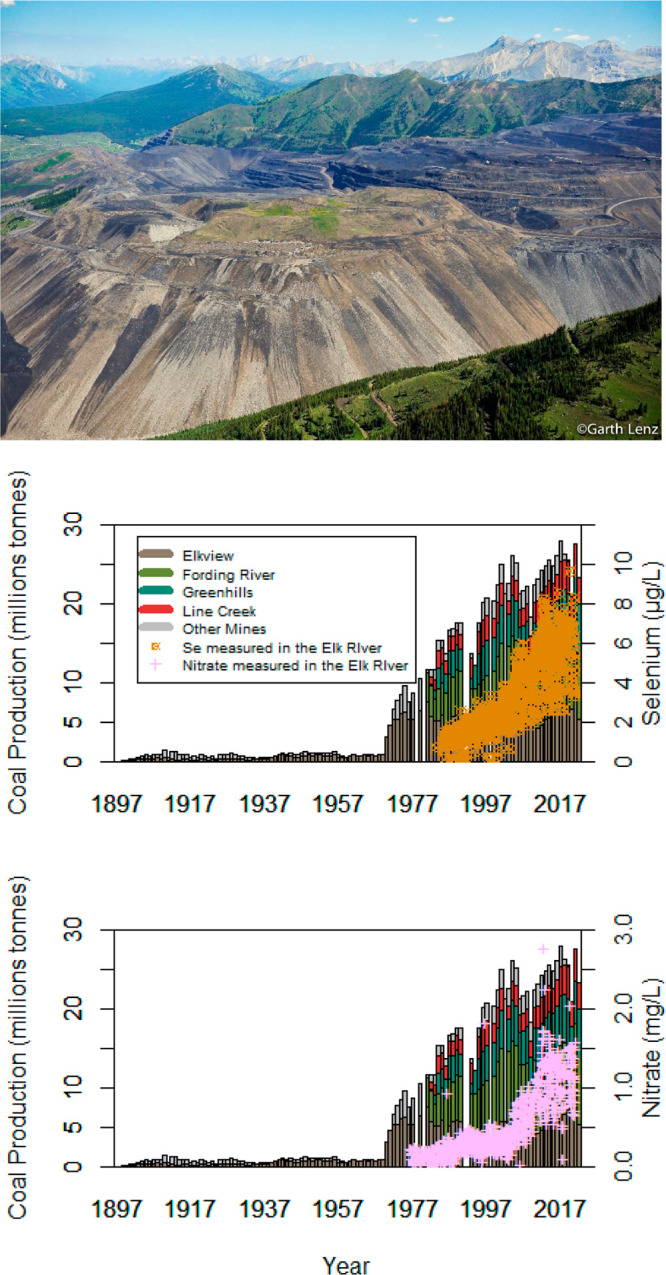
Figure 2.

Coal production in the Elk River Watershed. Aerial image of one area of mine operations within the watershed. Copyrighted, used with permission via licensing agreement with Garth Lenz. Plots illustrate yearly coal production by mine, represented by different colors,16 and measured concentrations of total Se and NO3– in the Elk River and Highway 93.22
