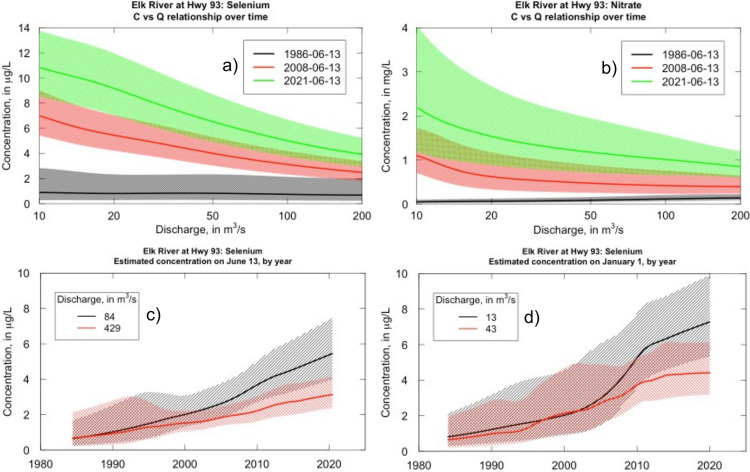
Figure 4.
Concentration vs discharge relationships for total Se (a) and NO3– (b) in the Elk River at Highway 93.22,65 Colored lines (a,b) show modeled C–Q relationships for three different dates, illustrating changes in the solute behavior over time. Shading (a, b) shows the 90% prediction interval for each date. (c,d) illustrates changes in concentration over time at two different discharges and two times of the year. (c) illustrates patterns at the high discharge time of year (June 13) and (d) shows a low discharge time of year (Jan 1). Lines (c, d) represent the 5th (black) and 95th (red) percentiles for flow duration curves for 60 days around each date (30 days before and after). Shading (c, d) shows the 90% prediction interval for each flow. Additional solutes and Kootenay River data are shown in SI Figures 11 and 12.

