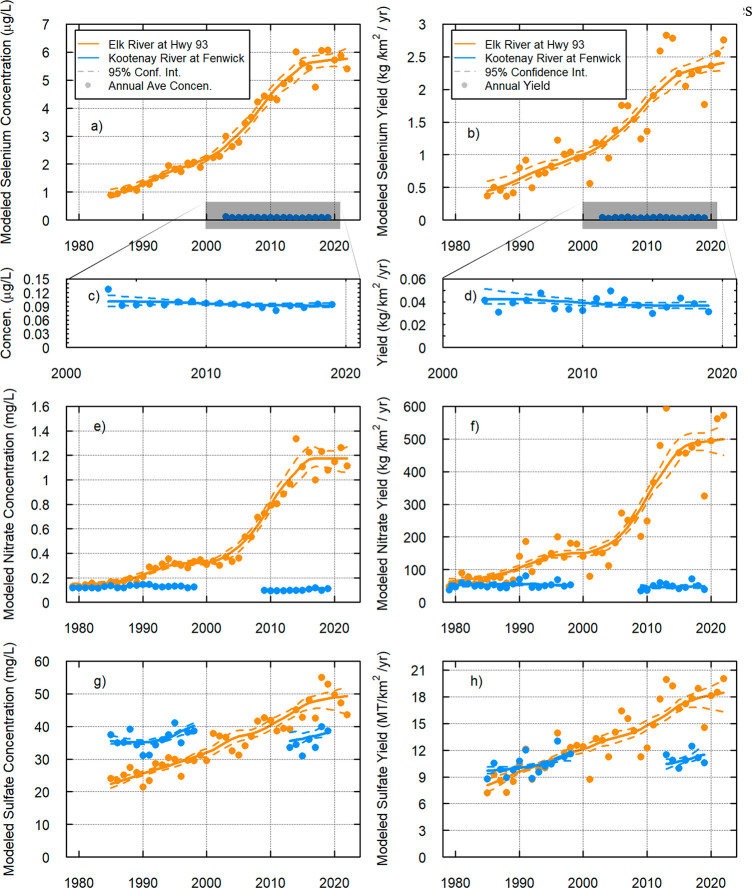
Figure 5.
Flow-normalized trends for the Elk River (orange) and the Kootenay River (blue).22,48,65 Concentration trends for each constituent are on the left (a, c, e, g), and trends in yield (i.e., area normalized load) are on the right (b, d, f, g).22 Each row is a constituent: (a, b) total Se, (c, d) total Se for the Kootenay River only, (e, f) NO3–, and (g, h) SO42–. Solid dots are mean annual concentration or annual yield. Dashed lines are 90% confidence intervals.65

