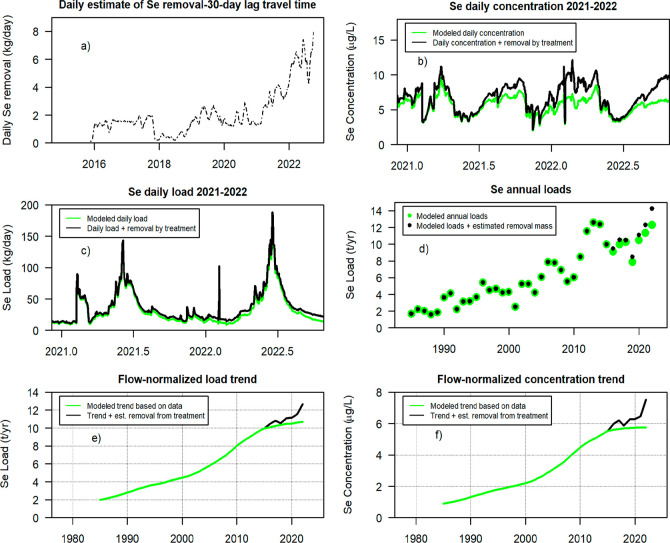
Figure 6.
Modeled influence of Se mass removal from three mine water treatment facilities in the Elk River Watershed.22 Estimated Se removal by water treatment in the Elk River at Highway 93, using a 30 day lagged running mean (a). Estimated daily concentration (b) and load (c) of Se in the Elk River at Highway 93 (only 2021 and 2022 are shown for temporal resolution). The green line (b,c,e,f) is an estimate based on the model optimized for accuracy (WRTDS_Kalman).71,72 The black line (b,c,e,f) is based on this same model with the addition of the estimated amount of Se that was removed by treatment. Green dots (d) are the estimated annual load of Se for the Elk River WRTDS_Kalman model. Black dots (d) are the annual loads if there was no treatment. The flow-normalized trends for load (e) and concentration (f) in black, are an estimate of the trends in the absence of treatment, compared to what was observed (modeled) in green.

