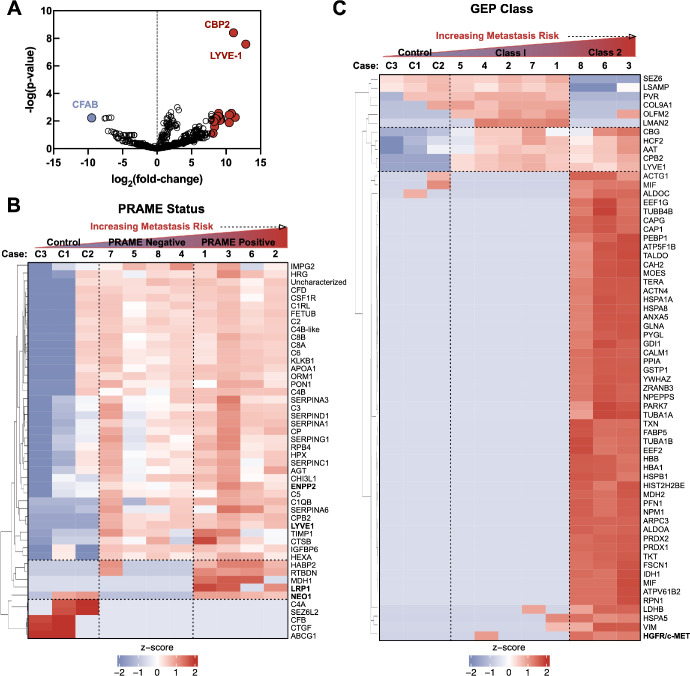
Figure 2.
Shotgun proteomic signatures differentiate molecular classes of uveal melanoma. (A) Differentially expressed proteins (between UM and control vitreous) detected by LC-MS/MS represented as a volcano plot. The horizontal axis (x-axis) displays the log2 fold-change value (UM versus controls) and the vertical axis (y-axis) displays the noise-adjusted signal as the -log10 (P value). (B) Multi-group comparison (1-way ANOVA) followed by hierarchical heat map clustering was used to identify differentially expressed proteins based on PRAME status and GEP class. When comparing protein expression by PRAME status, there were 48 differentially expressed proteins at the P < 0.05 level. Results are represented as a heatmap and display protein expression levels on a logarithmic scale. Red indicates high expression whereas white/blue indicates low or no expression. (C) When comparing protein expression by GEP class, there were 53 differentially expressed proteins at the P < 0.05 level.

