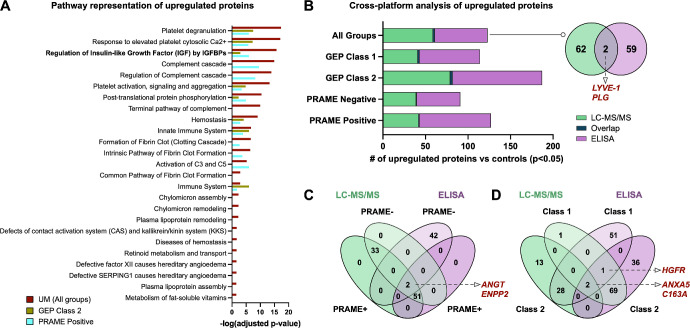
Figure 3.
Cross-platform identification and validation of UM biomarkers. (A) Top pathways represented in UM vitreous. Pathways are ranked by their -log (P value) obtained from the right-tailed Fisher's Exact Test and colored by their respective subclassification: GEP class 2, yellow; PRAME positive, cyan; and all UM samples, red. (B) Comparative analysis of upregulated proteins in UM vitreous detected by two separate proteomics platforms (i.e. multiplex ELISA and LC-MS/MS). Lists of upregulated proteins (compared to controls) at the P < 0.05 level were analyzed by Venn diagram analysis. Two proteins were shared between the two platforms: LYVE-1 and plasminogen. (C) Venn diagram analysis of upregulated proteins, sorted by PRAME status. Two proteins (angiotensinogen and ENPP2) were commonly detected by LC-MS/MS and multiplex ELISA. (D) Venn diagram analysis of upregulated proteins, sorted by GEP class. There were 2 commonly identified proteins (C163A and ANXA5) among GEP class 1 samples and 3 commonly identified proteins (HGFR, ANXA5, and C163A) among GEP class 2 samples.

