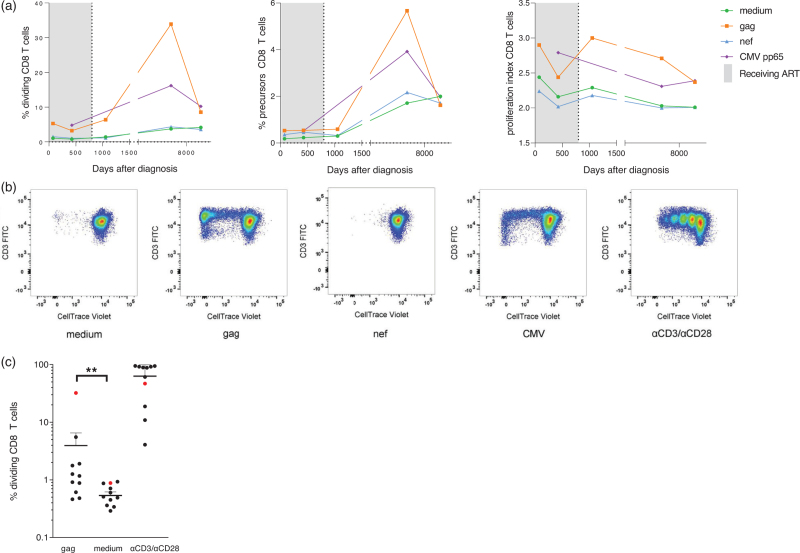
Fig. 4.
HIV-specific CD8+ T-cell response.
(a) Longitudinal frequencies of dividing CD8+ T cells, precursor CD8+ T cells, and proliferation indices upon peptide pool stimulation. (b) Representative flowcytometry plots (y-axis CD3 FITC and x-axis CellTrace Violet). (c) Percentage of dividing CD8+ T cells upon Gag peptide stimulation, compared to medium (negative control) and α-CD3/α-CD28 stimulation (positive control). Red dot: person described in this study. Black dots: untreated, chronic HIV positive individuals from the ACS cohort (Supplementary Methods).

