
Figure 2.
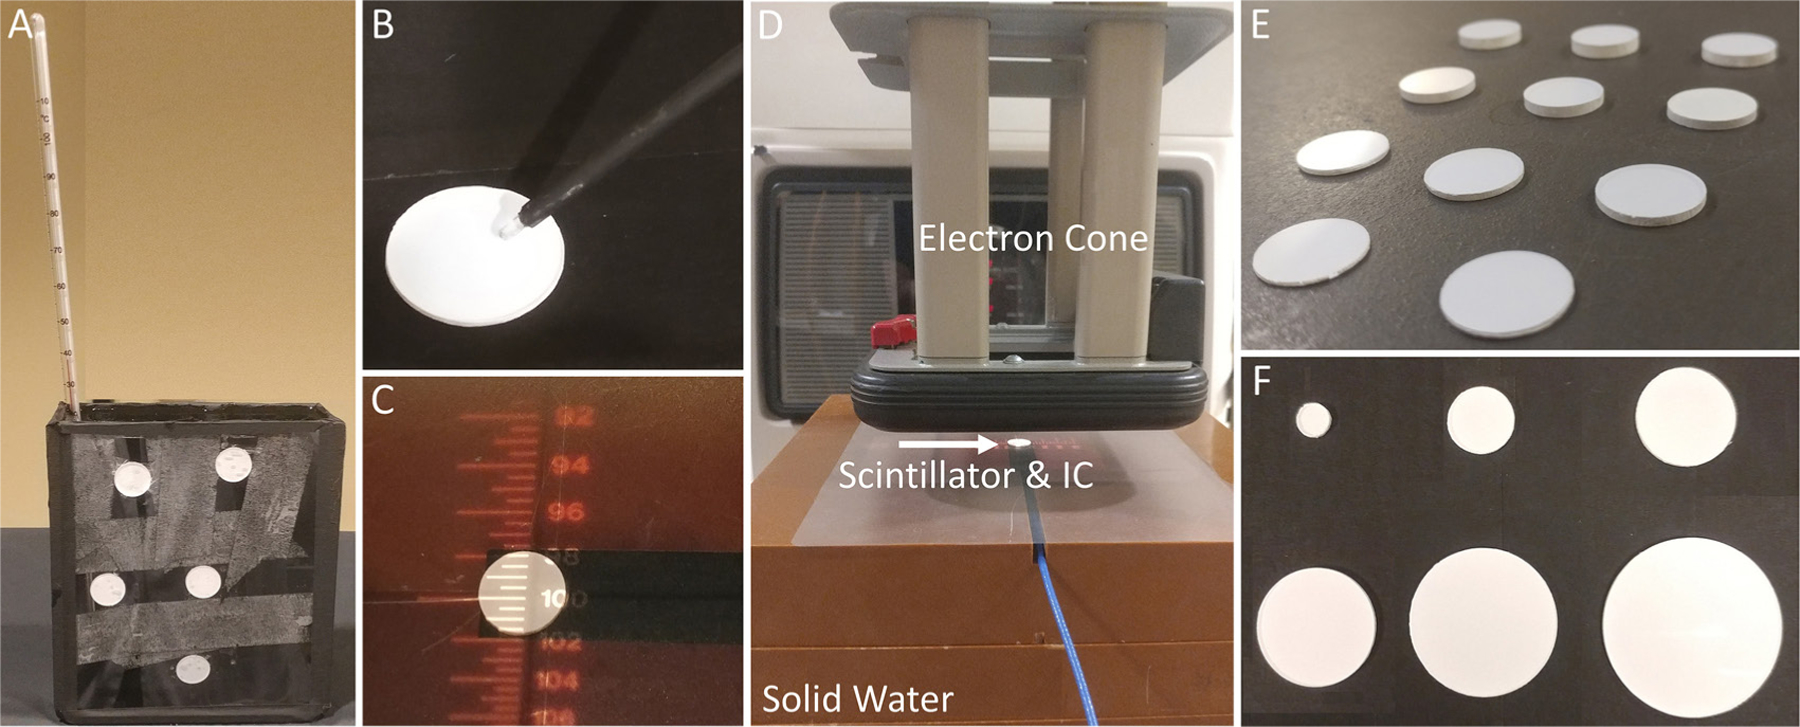
(A) Setup for temperature verus scintillator light output (B) spectrometer fiber optic probe setup (C) scintillator placed on-top of active volume of IC (D) set-up for testing effect of scintillator thickness on surface dose. Solid water, electron cone, and scintillator placed on-top of active volume of IC are labeled (E) scintillators of varying (0.65–3.13 mm) thickness (F) scintillators of varying (5–30 mm) diameters.