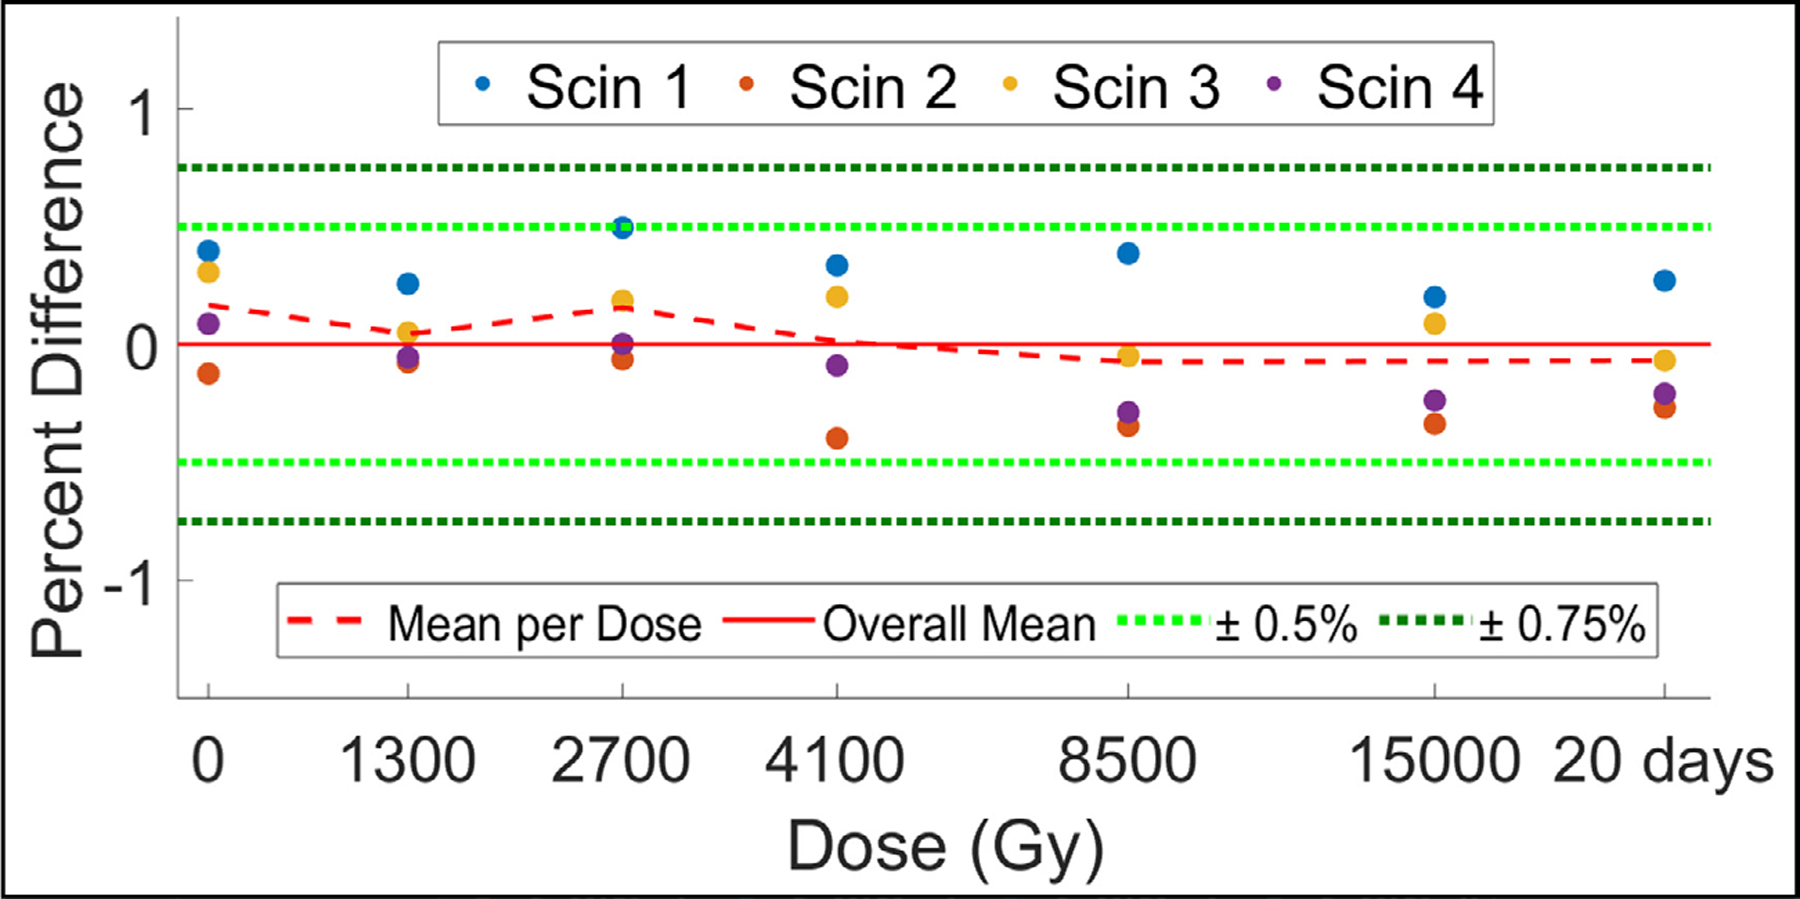
Figure 6.

Scintillator output for a group of 4 new scintillators after being exposed to a cumulative dose of 15 000 Gy. Data is presented as percent difference from overall mean of all data collected (solid red line). A verification measurement taken 20 d post-15 000 Gy exposure is also shown. Mean percent difference from overall mean per exposed dose is displayed as a dotted red line. ±0.5% and ±1.0% are in dotted light and dark green lines, respectively.
