
Figure 7.
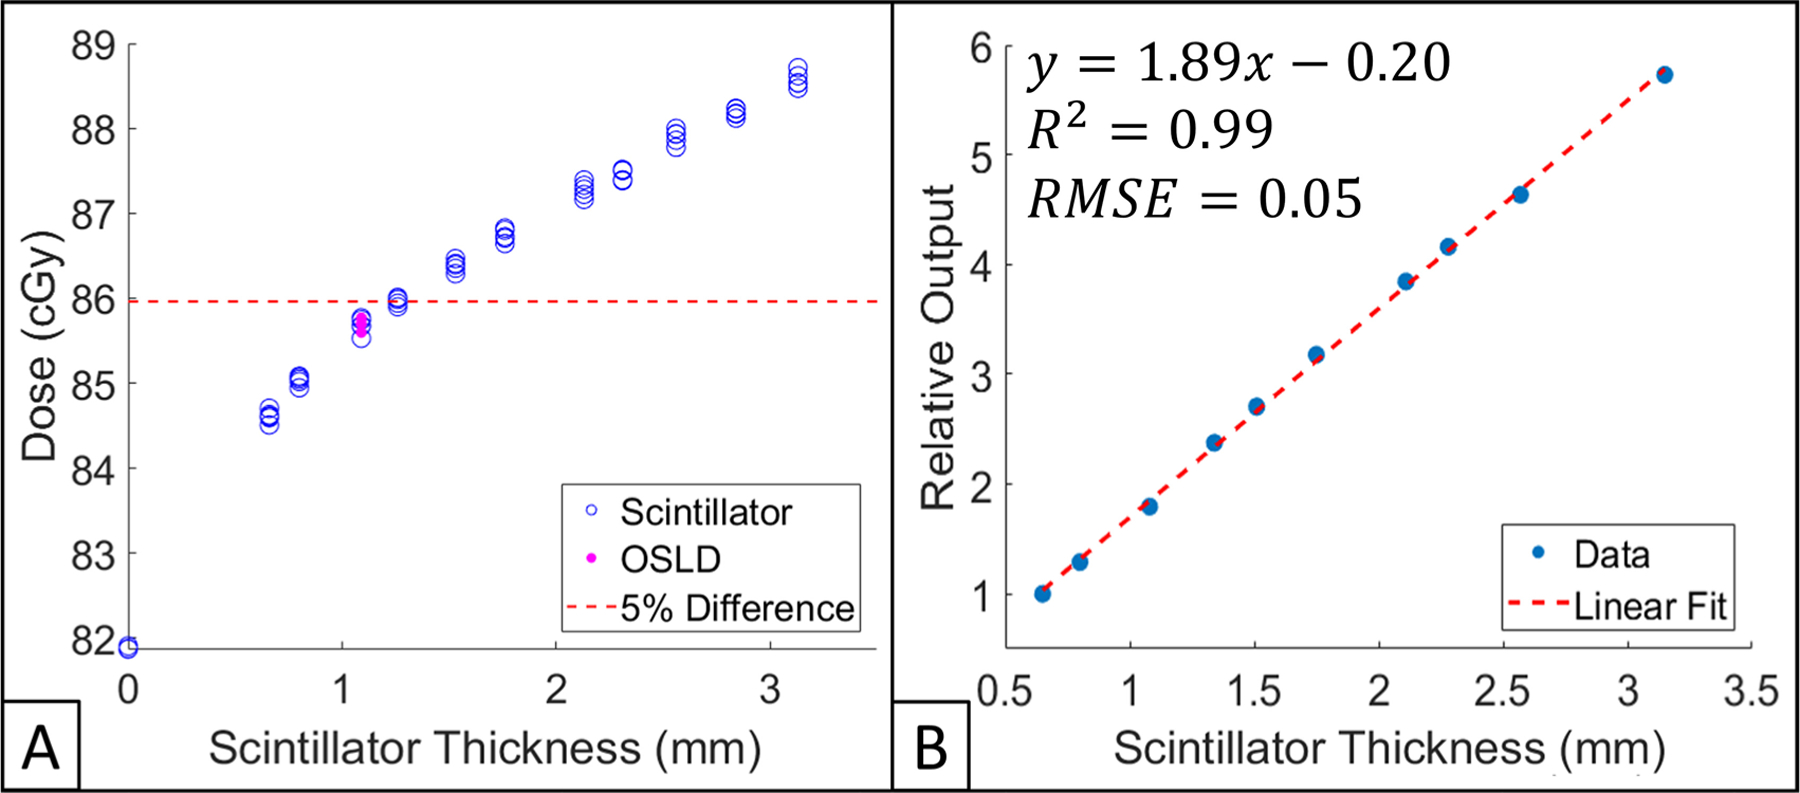
(A) Impact of scintillator thickness on surface dose measured by IC. All data points are normalized to IC reading obtained with no dosimeter present (baseline). 5% from baseline is shown as a dotted red line. IC measurements obtained with scintillators and an OSLD place upon the IC are shown in hollow blue circles and filled pink dots, respectively. (B) Scintillator light output as a function of thickness. All data points are normalized to the thinnest dosimeter (0.66 mm). Linear fit, as well as corresponding R2 and RMSE are shown.