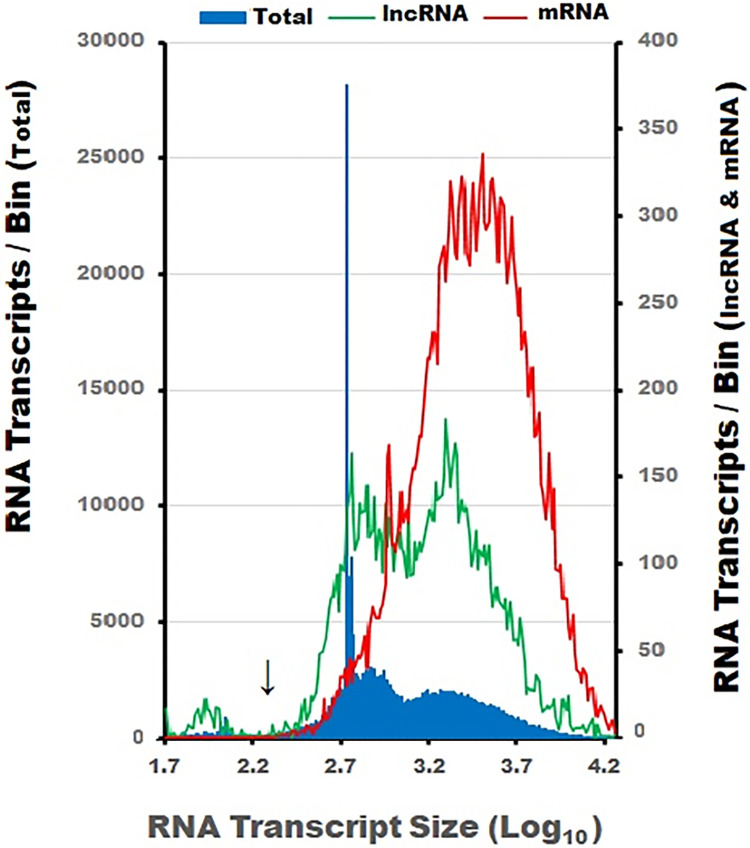
Fig 1. The size distributions of NCBI transcripts.
The solid blue fill depicts the size of 226,019 RNA transcripts from reference genome GRCh37.p13[hg19]. RNA transcripts ranging in size from 5 to 347,561 bp were assigned to an interval (200 bins) based on their Log10 base pair dimension (left y-axis). The x-axis scale range in Fig 1 is truncated and limited to transcripts ranging in size from 5–30,000 bp. The red line represents the size distribution of 19,608 mRNA transcripts (right y-axis) in which variant one represents the size designation of genes containing multiple size variants. The green line depicts the size distribution of 6,725 lncRNA transcripts. The black arrow identifies the 200 bp size cutoff for the RNAzol-BD extraction protocol [30]. A sizable proportion of the RNA depicted around 550–560 bp is associated with lncRNA transcripts [38]. The size dimensions of the mRNA and lncRNA transcripts used in our analysis overlap considerably.

