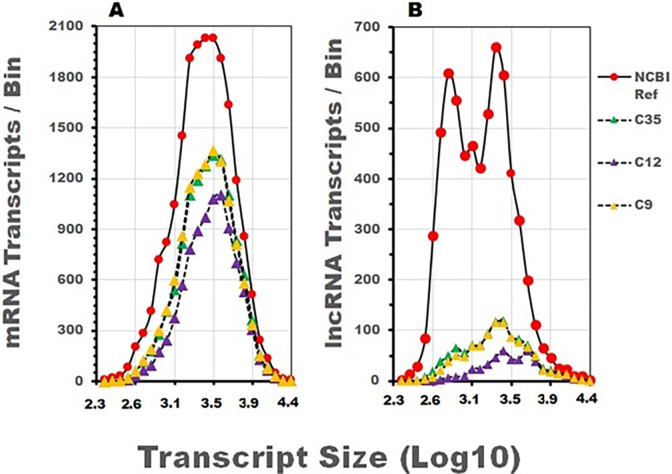
Fig 3. Size distribution of mRNA and lncRNA sequenced transcripts extracted with different methodologies.
The size distribution of mRNA A) and lncRNA B) transcripts identified in the NCBI transcript reference list is plotted in relation to increasing transcript size measurements ranging from 200 to 30,000 bp (red circles) and used to provide a reference for sequenced RNA recovered from three independent data sets. The number of mRNA transcripts and their size distribution in the C9 and C35 data sets closely overlap while the C12 data set contains fewer total transcripts and a noticeable reduction of short and midsize transcripts. A smaller number of total lncRNA transcripts were identified in the C9 and C35 data sets and their distributions overlap. Similarly, to the mRNA size distributions in Fig 3A, the short and midsized lncRNA transcripts were also visibly diminished in the C12 data set.

