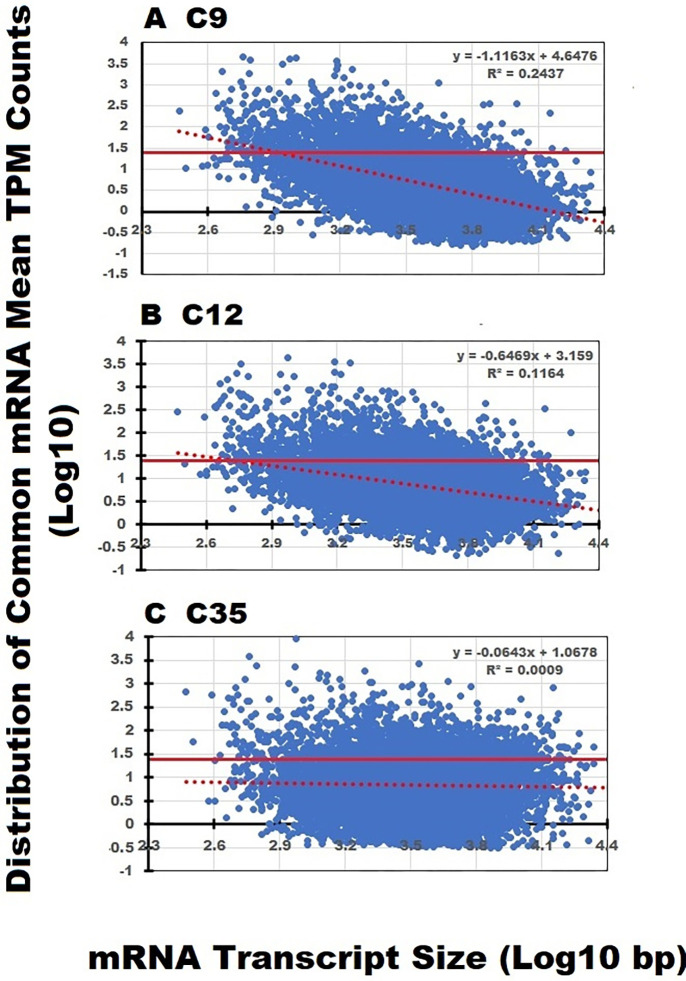
Fig 4. Relationship of transcript mean TPM counts to transcript size among 8721 transcripts identified in all three data sets.
The mean TPM count for the individual transcripts was plotted in relation to the transcript size. The normalized sample mean of 22.93 is depicted by the solid red line. The mRNA transcript distribution plots depicted for C9 and C12 are similar, and both display negative regression lines (red dashed line). The solid and dashed red lines depicting the sample mean and regression line, respectively, of the C35 data sets are almost parallel. Since the total number of transcripts in all three data sets are identical, this result could only occur if the relative distribution of counts assigned to the distinct size transcripts has changed.

