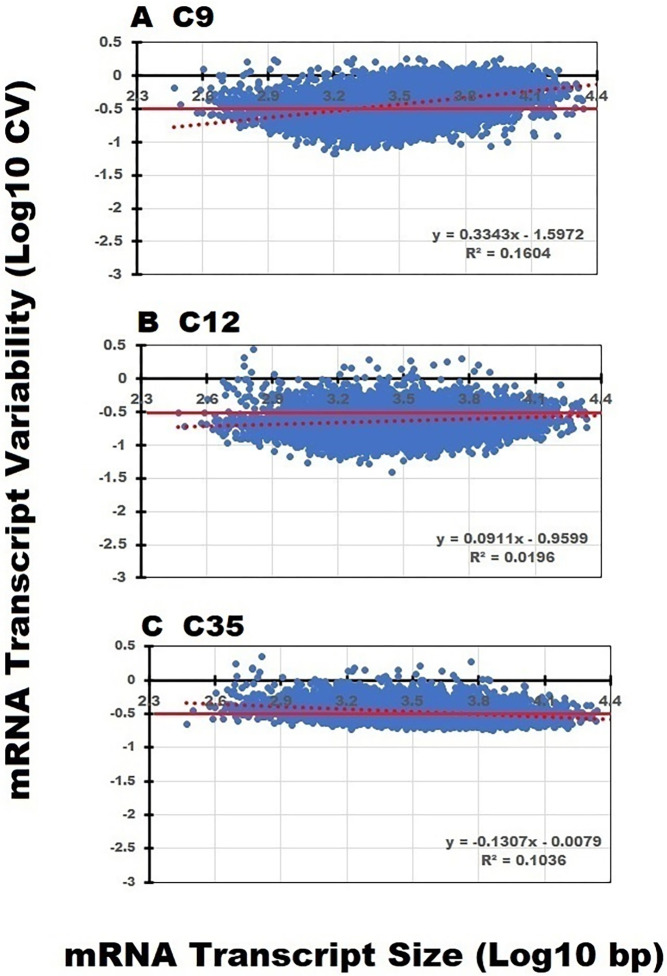
Fig 5. Impact of transcript size on sequencing variability.
The positive slope line depicted by the red dashed line in the C9 and C12 data sets suggests that variability is increasing in relation to transcript size. Unlike the C9 and C12 data sets, the CV distribution within the C35 data set is less variable and more evenly distributed across all transcript sizes. The regression slope line of CV dispersion in the C35 data set is negative suggesting that the smaller mRNA transcripts are more variable, and the CV values decline with increasing transcript size.

