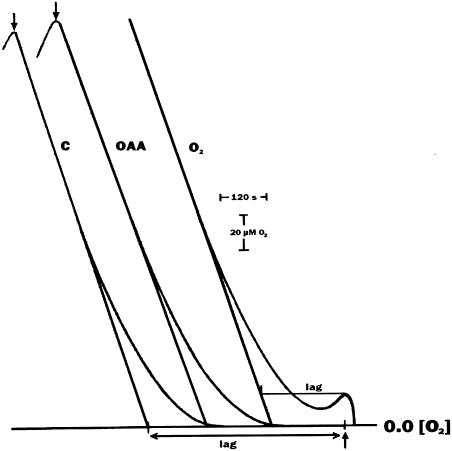
Figure 1.
Effect of O2 and OAA on the lag of O2 evolution upon starting low light intensity illumination of state 2, anaerobic C. reinhardtii cells. Light was turned on at the upward arrow and off at the downward arrow. O2 was added where indicated by the rising trace, upon injection of H2O2 to the catalase-containing oxygen electrode cell. OAA was 2 mm and added O2 was 20 μm. Chlorophyll was 150 μg mL−1 and light intensity was 54 μmol m−2 s−1 Other conditions as in Table I. C, Control. The lag time is defined as the intercept of the straight line drawn from the steady-state O2 evolution trace with the straight line on the time scale, starting at the beginning of illumination (see also Finazzi et al., 1999).

