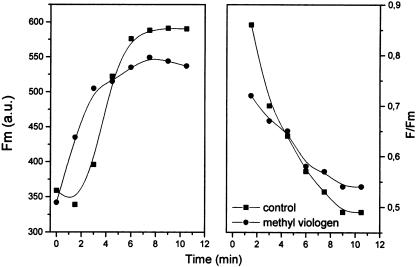
Figure 4.
Influence of MV on the state 2-to-state 1 transition. Chlorophyll was 50 μg mL−1 and light intensity was 24 μmol m−2 s−1. MV was 100 μm, added during the dark anaerobic treatment. Other conditions and procedures as in Table I. Fluorescence in arbitrary units. F indicates the fluorescence actually measured (see text), and Fm has the usual meaning of maximal fluorescence. The data are the average of three experiments, differing by less than 10%.

