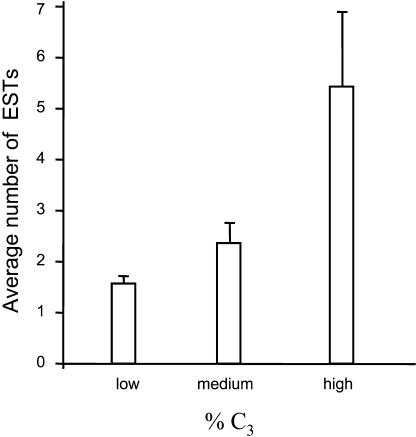
Figure 5.
Correlation of expression and %C3 content of P. tricornutum transcripts. P. tricornutum NRS sequences with soundly assigned frames were classified by increasing %C3, divided into 3 groups with equal numbers of sequences, and their average redundancy within the redundant EST collection was calculated. Bars indicate the se.

