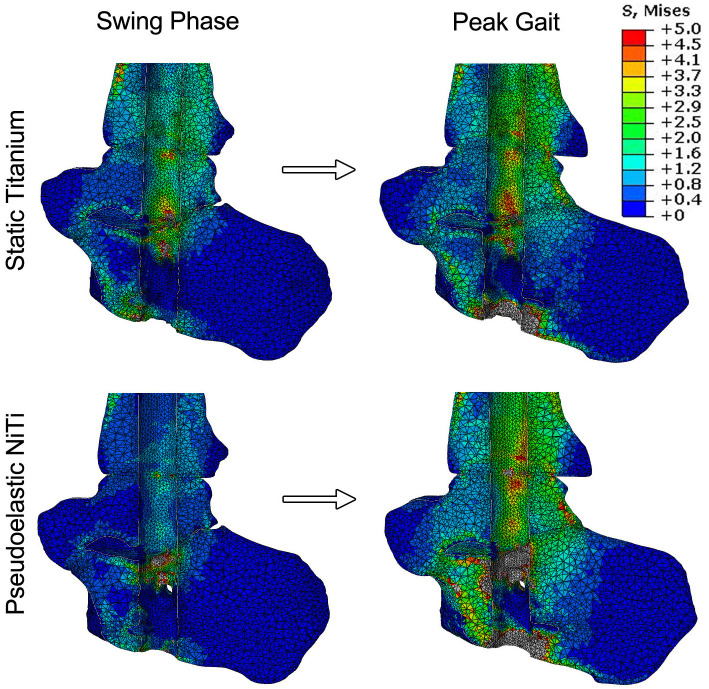
Fig 5. Bone stresses under simulated gait loading.
Stress maps showing the distribution of stress within the ankle at swing phase and peak loading. In these images, the IM nail was subtracted from the analysis to show the stress changes in the bone only. The static CFRP nail is not shown due to its close similarity to the static titanium nail.

