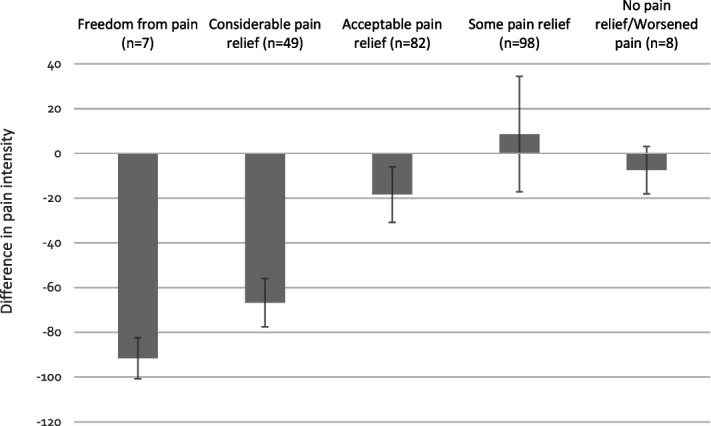
Figure 4.

Mean difference in pain intensity between baseline and follow-up, by category of effect of stimulation. Error bars represent 95% confidence interval.

Mean difference in pain intensity between baseline and follow-up, by category of effect of stimulation. Error bars represent 95% confidence interval.