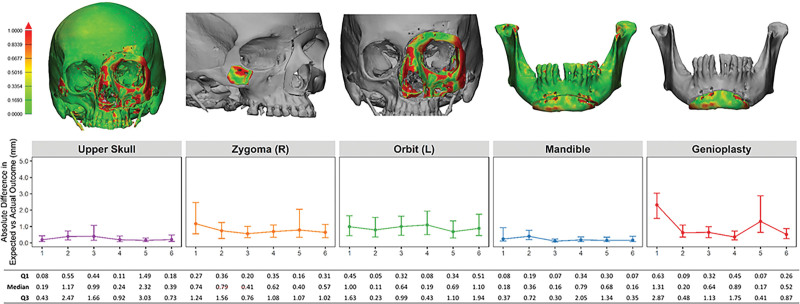
Fig. 6.
Expected vs actual osteotomy inset outcomes by subunit. Heatmap of inset accuracy by subunit (top row). Median and interquartile range for absolute difference in millimeters (line graph and table). Measured by comparing postoperative CT scans with the projected outcome based on virtual surgical planning. Printed with permission and copyrights retained by Eduardo D. Rodriguez, MD, DDS.

