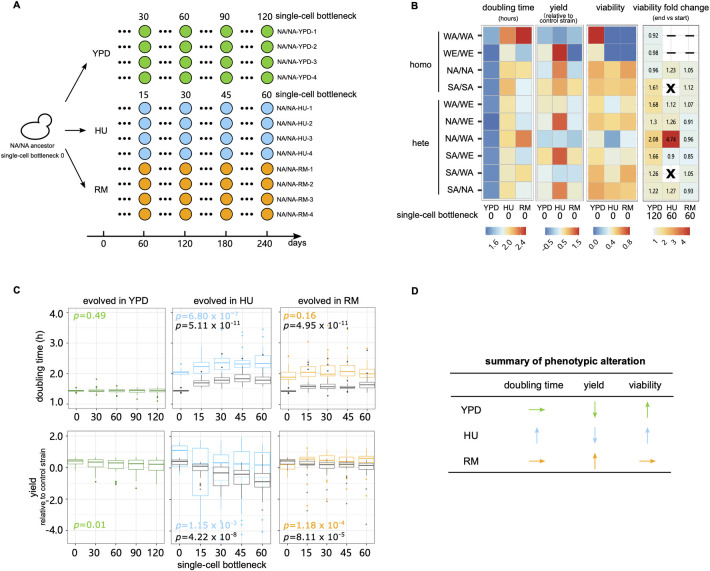
Fig 1. MALs design and fitness.
(A) We evolved MALs for a total of 120 (YPD) and 60 (HU and RM) single-cell bottlenecks. The ten genetic backgrounds included four diploid homozygous strains (WA—West African, WE—Wine/European, NA—North American, SA—Sake) and all six possible hybrids derived from them. For each strain, we initiated 4 replicated MALs in each condition named as “strain-condition–replicate”, with e.g., “NA/NA-YPD-1” denoting the North American homozygote, evolved in YPD, replicate 1. Green, blue and orange circles represent the MALs in YPD, HU and RM respectively. The NA/NA genetic background MALs overview is shown as example. (B) Heatmap show the cell doubling time (hours), cell yield (log2 cell yield normalized to that of the spatial control strain, NA/WA) and cell viability. Cell viability in YPD is represented as CFUYPD/counted cells, while cell viability in HU and RM is calculated as CFUHU or RM/CFUYPD). “X” indicates MALs with all four replicates going extinct. “-” indicates strains excluded because of extremely low fitness in that condition and could not be propagated. (C) Evolution of cell doubling time and yield. Boxplots show the cell doubling time and yield in drug and drug-free conditions across the single-cell bottleneck (x-axis). Center line: median; box: interquartile range (IQR); whiskers: 1.5×IQR; dots: outliers beyond 1.5×IQR. Green, blue and orange boxplots represent the MALs phenotyped in their evolved condition (YPD, HU and RM respectively) while the gray boxplots represent MALs evolved in drugs but phenotyped in drug-free condition. The p value is measured by Mann–Whitney U test by comparing phenotypes at the initial and last timepoints of evolution. For each condition, the number of MALs included in the analysis (N) is NYPD = 40, NHU = 24, NRM = 32. (D) Qualitative summary of the direction in which each fitness proxy changes during the mutation accumulation.

