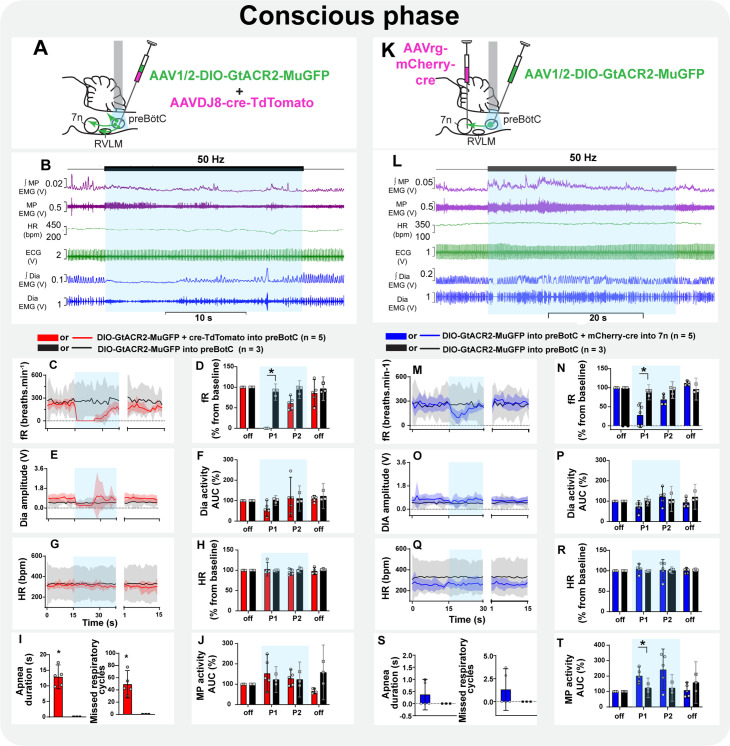
Figure 9. Inspiratory-related activity of mystacial pad is interrupted by the selective inhibition of pre-Bötzinger complex (preBötC) to 7n neurons in conscious rats.
Schematic diagrams showing the injection protocols for non-selective transduction of preBötC neurons (A) and selective transduction of preBötC→7n neurons (K). Representative trace showing the integrated (∫) and raw mystacial pad (MP) EMG, heart rate (HR), electrocardiograms (ECG), and ∫ and raw diaphragm (Dia) EMG after recovery from ketamine/medetomidine anesthesia in rats with non-selective (B) and selective (L) preBötC neuron transduction. The period of photoinhibition is highlighted with the blue box. Group data showing mean (solid line) and 95% confidence intervals for (C and M) respiratory frequency - fR, (E and O) Dia amplitude, (G and Q) and HR (bpm) before, during, and after photoinhibition in non-selective (red), selective GtACR2 expressing (blue) and control (black) rats. Histograms showing group data for the effect of photoinhibition of preBötC on respiratory and cardiovascular parameters (D and N) fR, (F and P) Dia amplitude, (H and R) HR, (I and S) apnea duration and number of missed respiratory cycles, and (J and T) MP activity; P1 and P2 refer to the initial period of photoinhibition. Group data are presented as mean ± 95% CI; unpaired t-test or nonparametric Mann-Whitney test with multiple comparisons using the Bonferroni-Dunn method, *p<0.05. The photoinhibition of preBötC neurons is depicted by blue shading.

