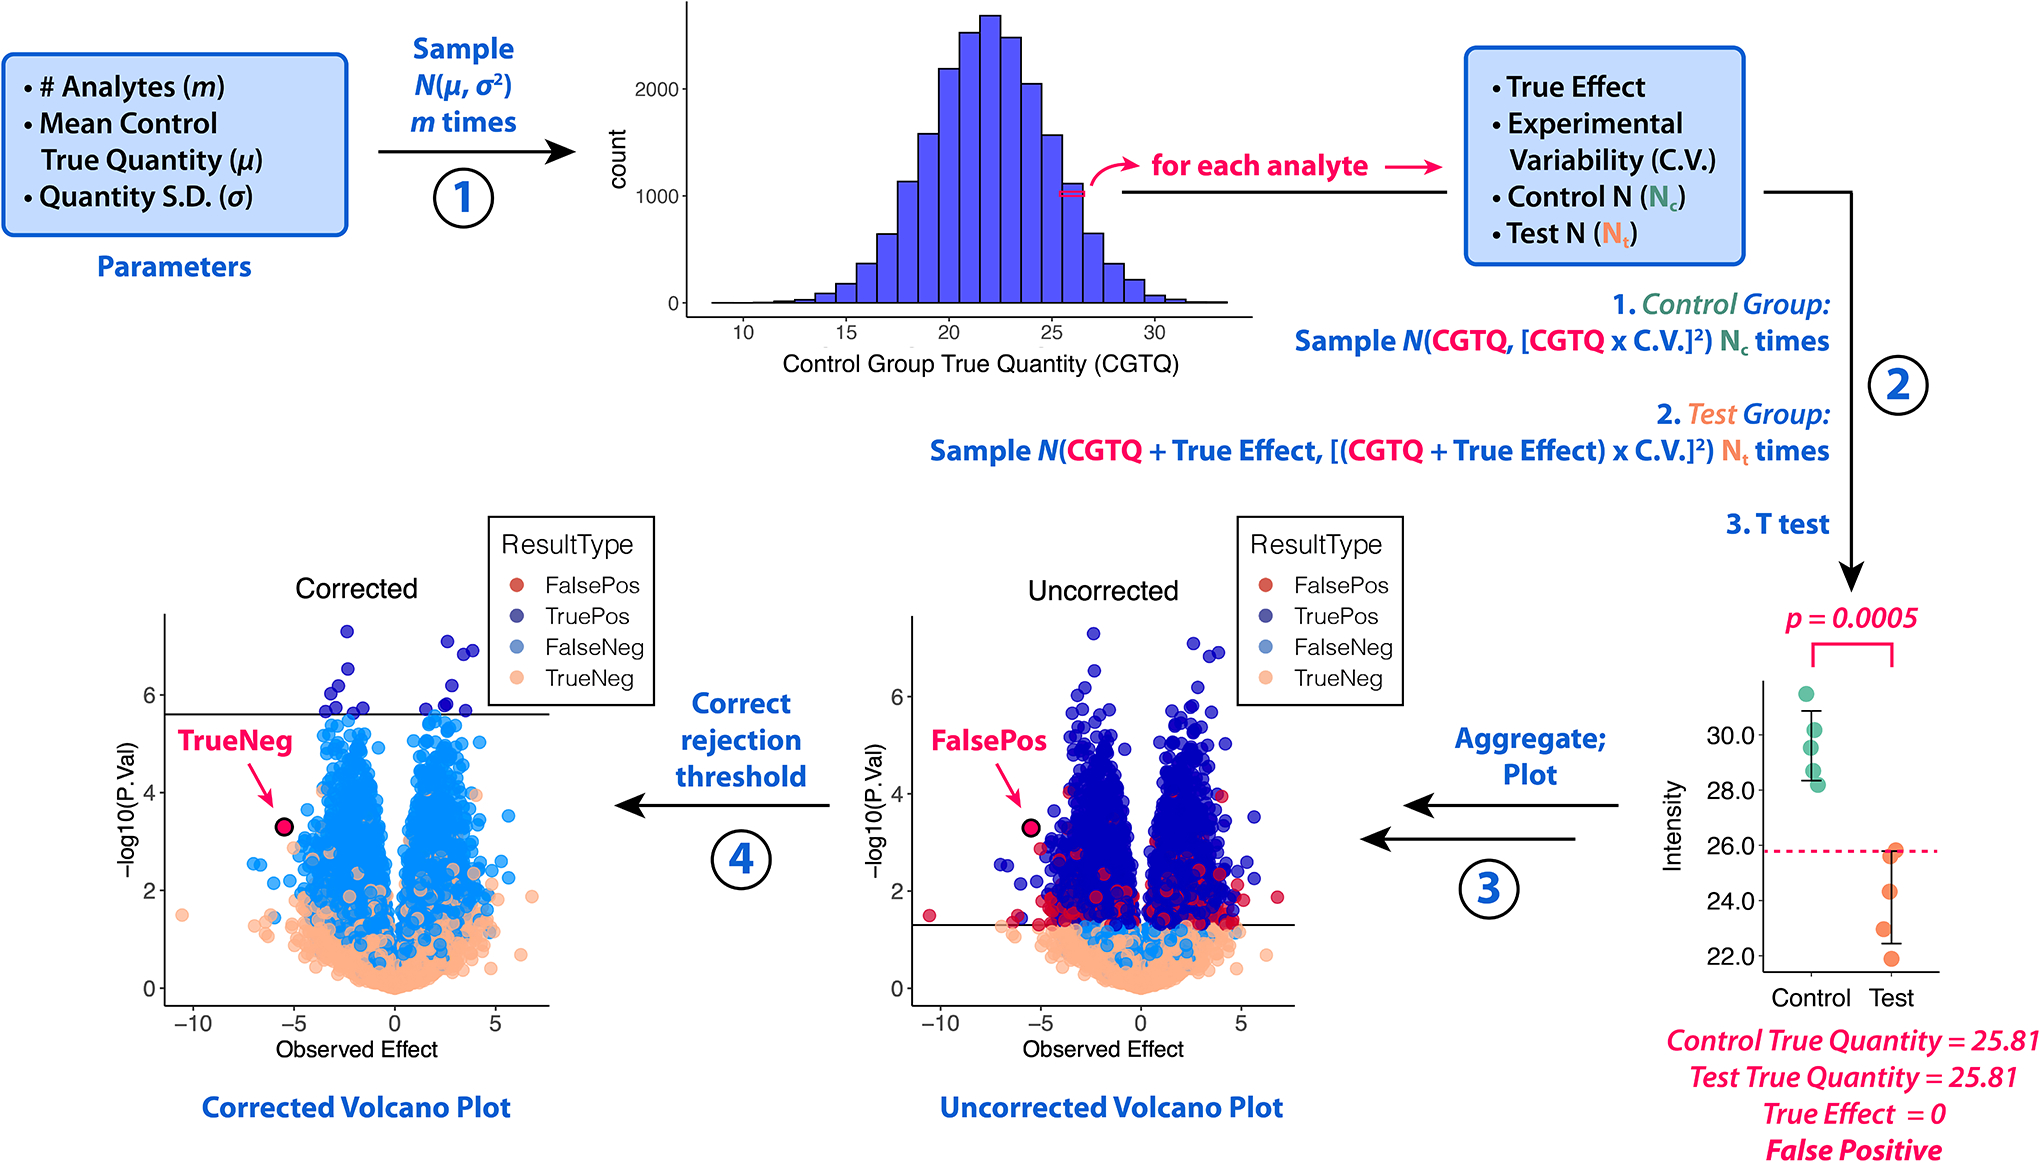
Figure 1. Simulator of P-Value Multiple Hypothesis Correction (SIMPLYCORRECT).

Step 1: The true quantity of each analyte in the control group (CGTQ) is generated. Step 2: Each analyte is “measured” Nc times in the control group and Nt times in the test group. Each analyte has its own True Effect; the Experimental Variability as a coefficient of variation (C.V.) is common among all analytes. A two-sided Welch’s T test is performed for each. Step 3: The results are plotted. Step 4: The p-values or rejection threshold is corrected and the corrected results are plotted. In this example, the Bonferroni method was applied, changing the highlighted analyte from a false positive (FalsePos) to a true negative (TrueNeg). S.D. = standard deviation. N(μ, σ2) represents the normal distribution with mean μ and variance σ2.
