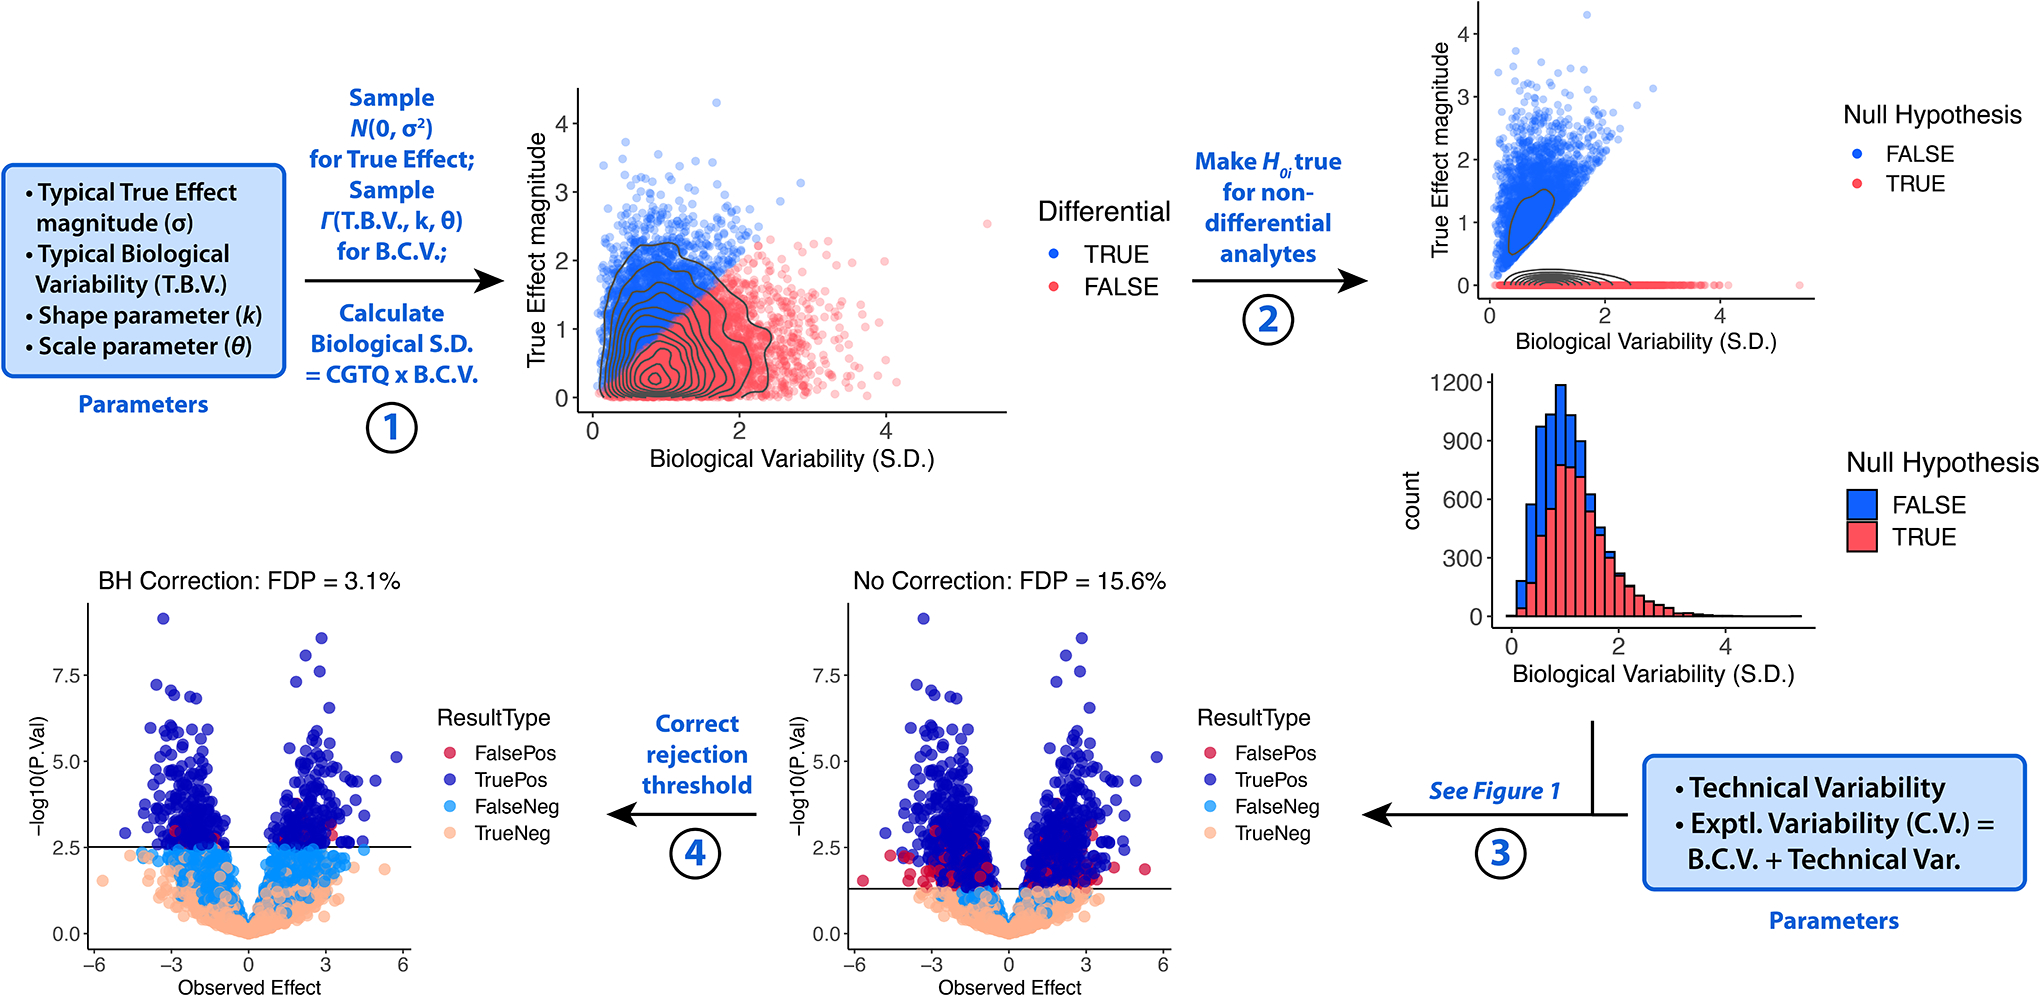
Figure 4. Generation of quantitative omic data with both true and false H0i: Model 3.

True Effects are generated by sampling a normal distribution m times (Step 1). Biological Variability values (B.C.V.) are sampled from a gamma distribution (Step 1), and for each analyte, if the True Effect magnitude is less than the Biological Variability S.D., then the True Effect is set to equal 0 (Step 2). For each analyte, the Experimental Variability (C.V.) is equal to B.C.V. + Technical Variability, where Technical Variability is an additional chosen parameter (Step 3). Measurements are then simulated and the rejection threshold corrected as illustrated in Figure 1 (Steps 3–4).
