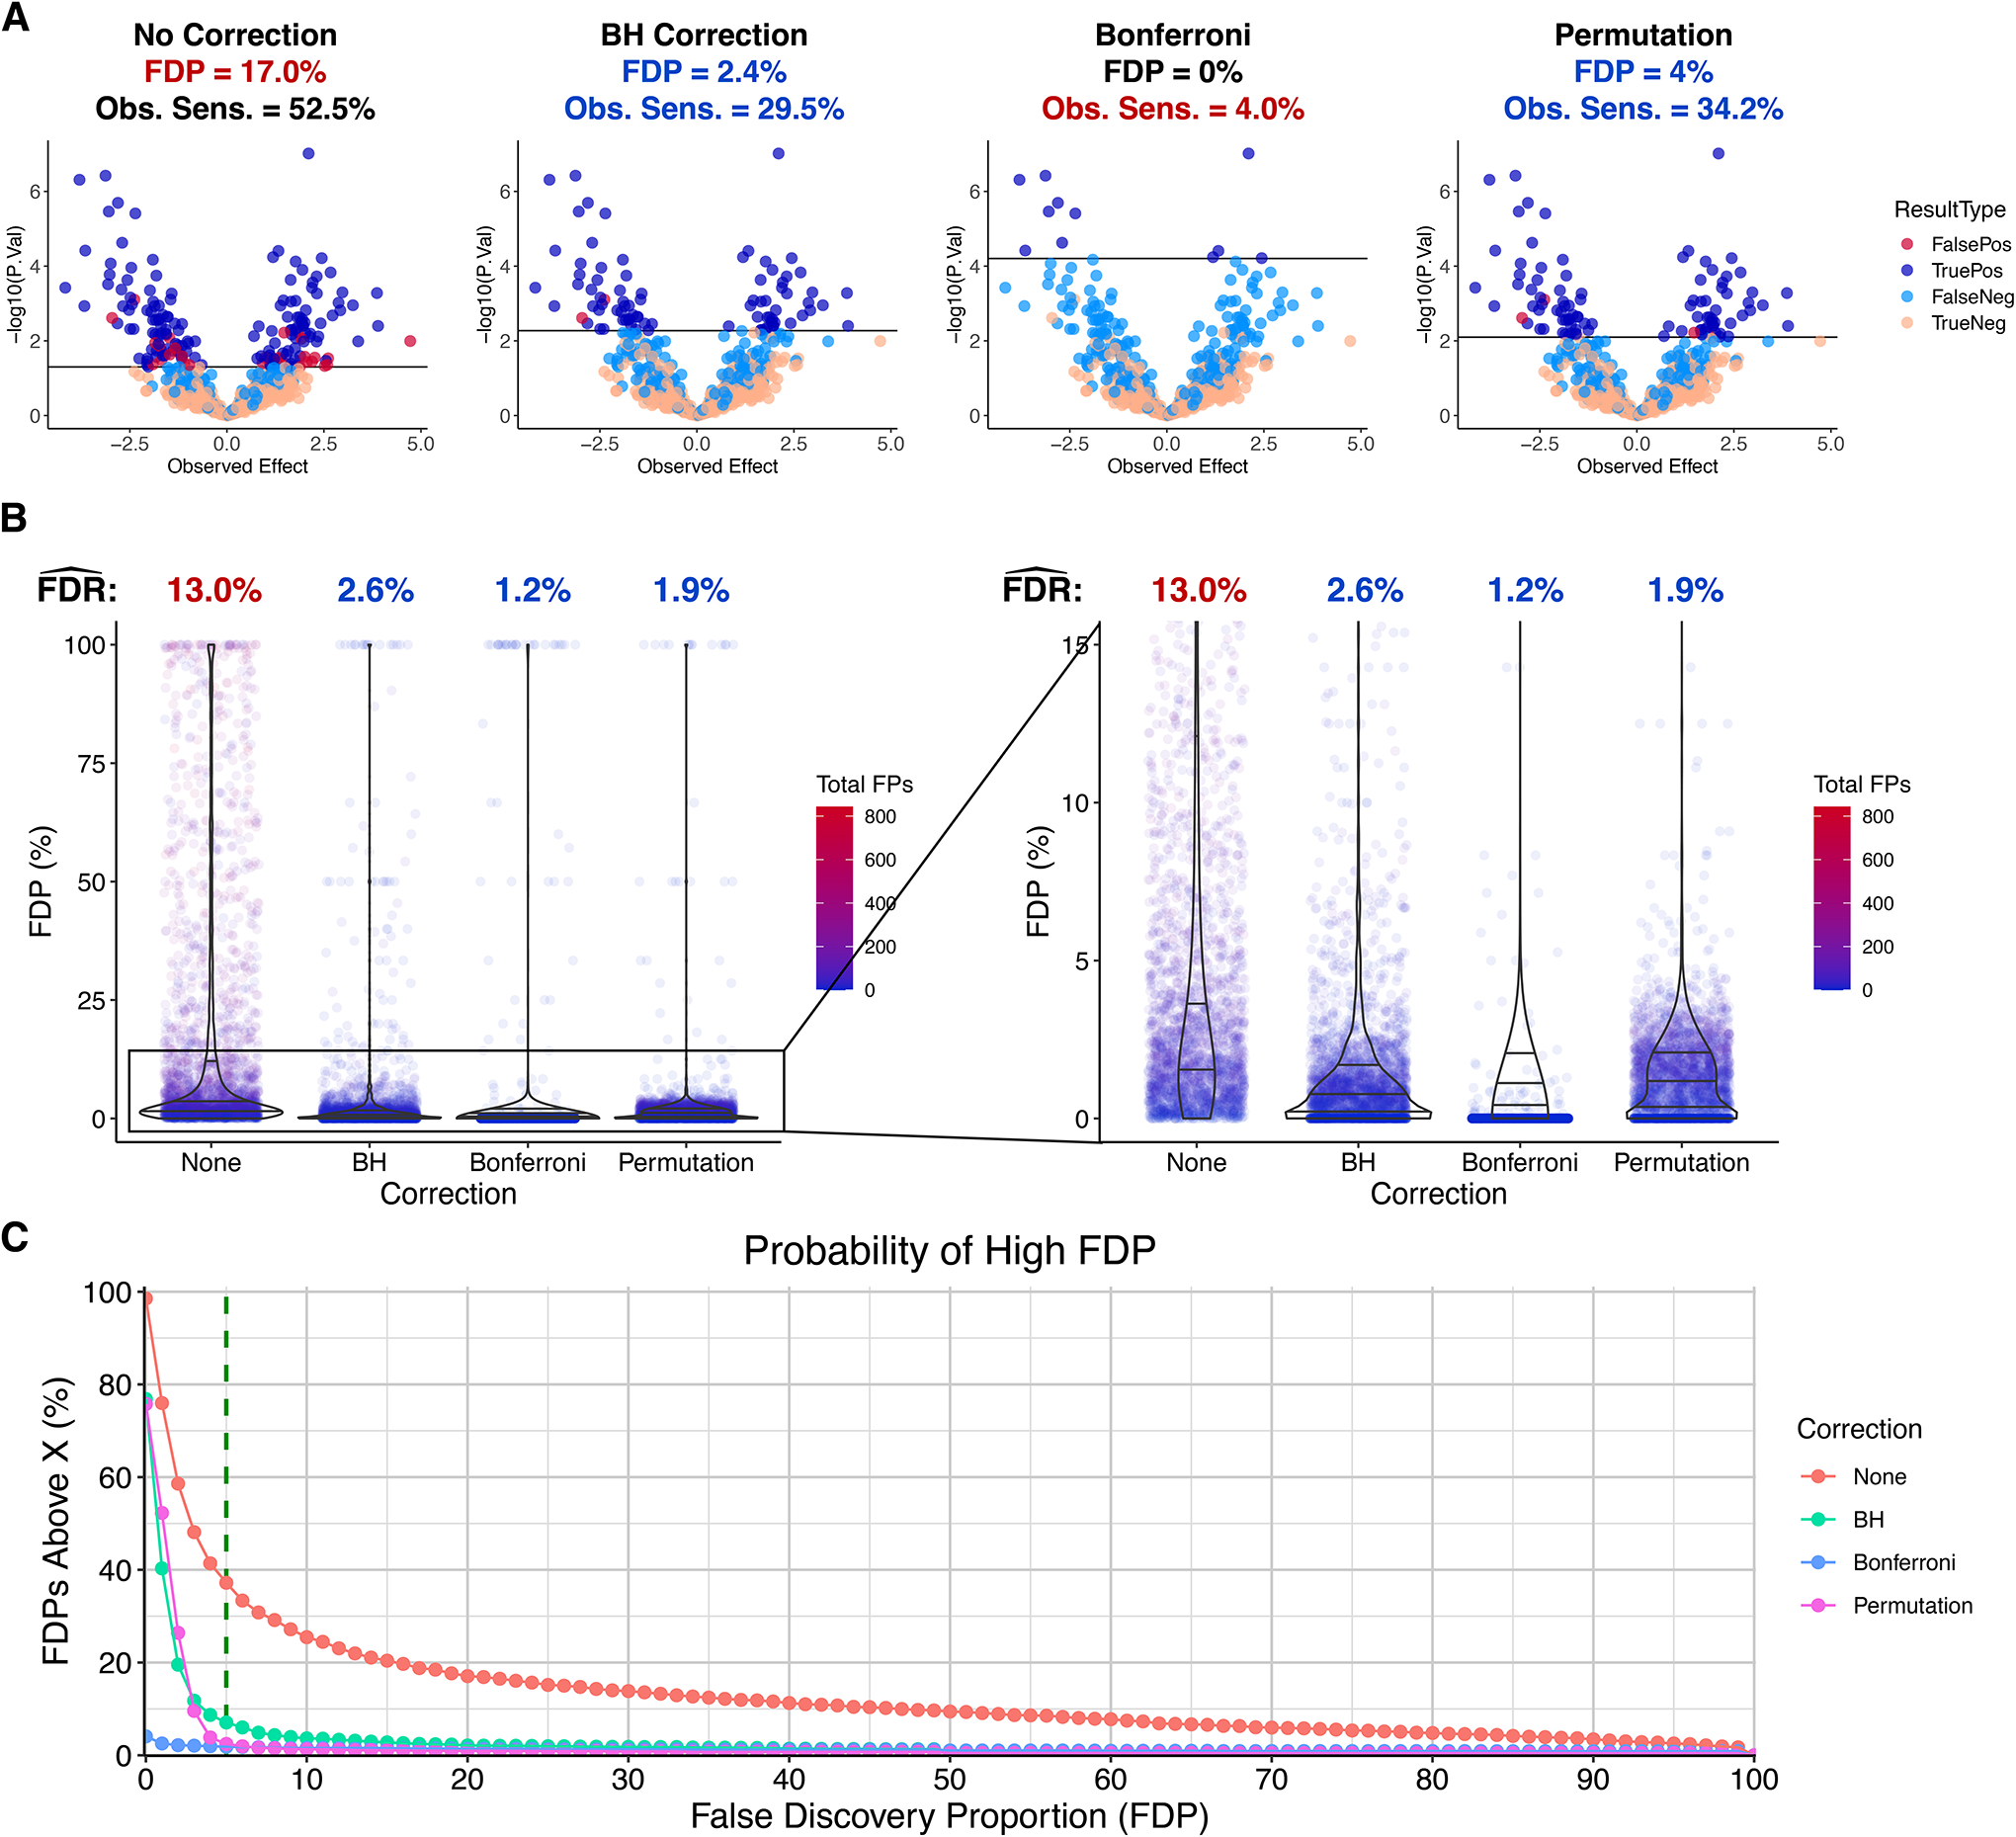
Figure 5. FDR benefits of p-value correction in 3,000 simulations with both true and false H0i.

A. Example of Model 3 simulation with both true and false underlying H0i. Parameters: m = 2,000, Nc = Nt = 11, Typical Biol. Var. (C.V.) = 0.05, Technical Var. (C.V.) = 0.03, Typical Effect = 1, k = 4, θ = 0.5, Significance Threshold = 0.05. B. FDP distributions and FDR estimates. . C. For each integer FDP between 0% and 100%, the percent of simulations that yielded an FDP greater than that value (X) is plotted along the Y axis.
