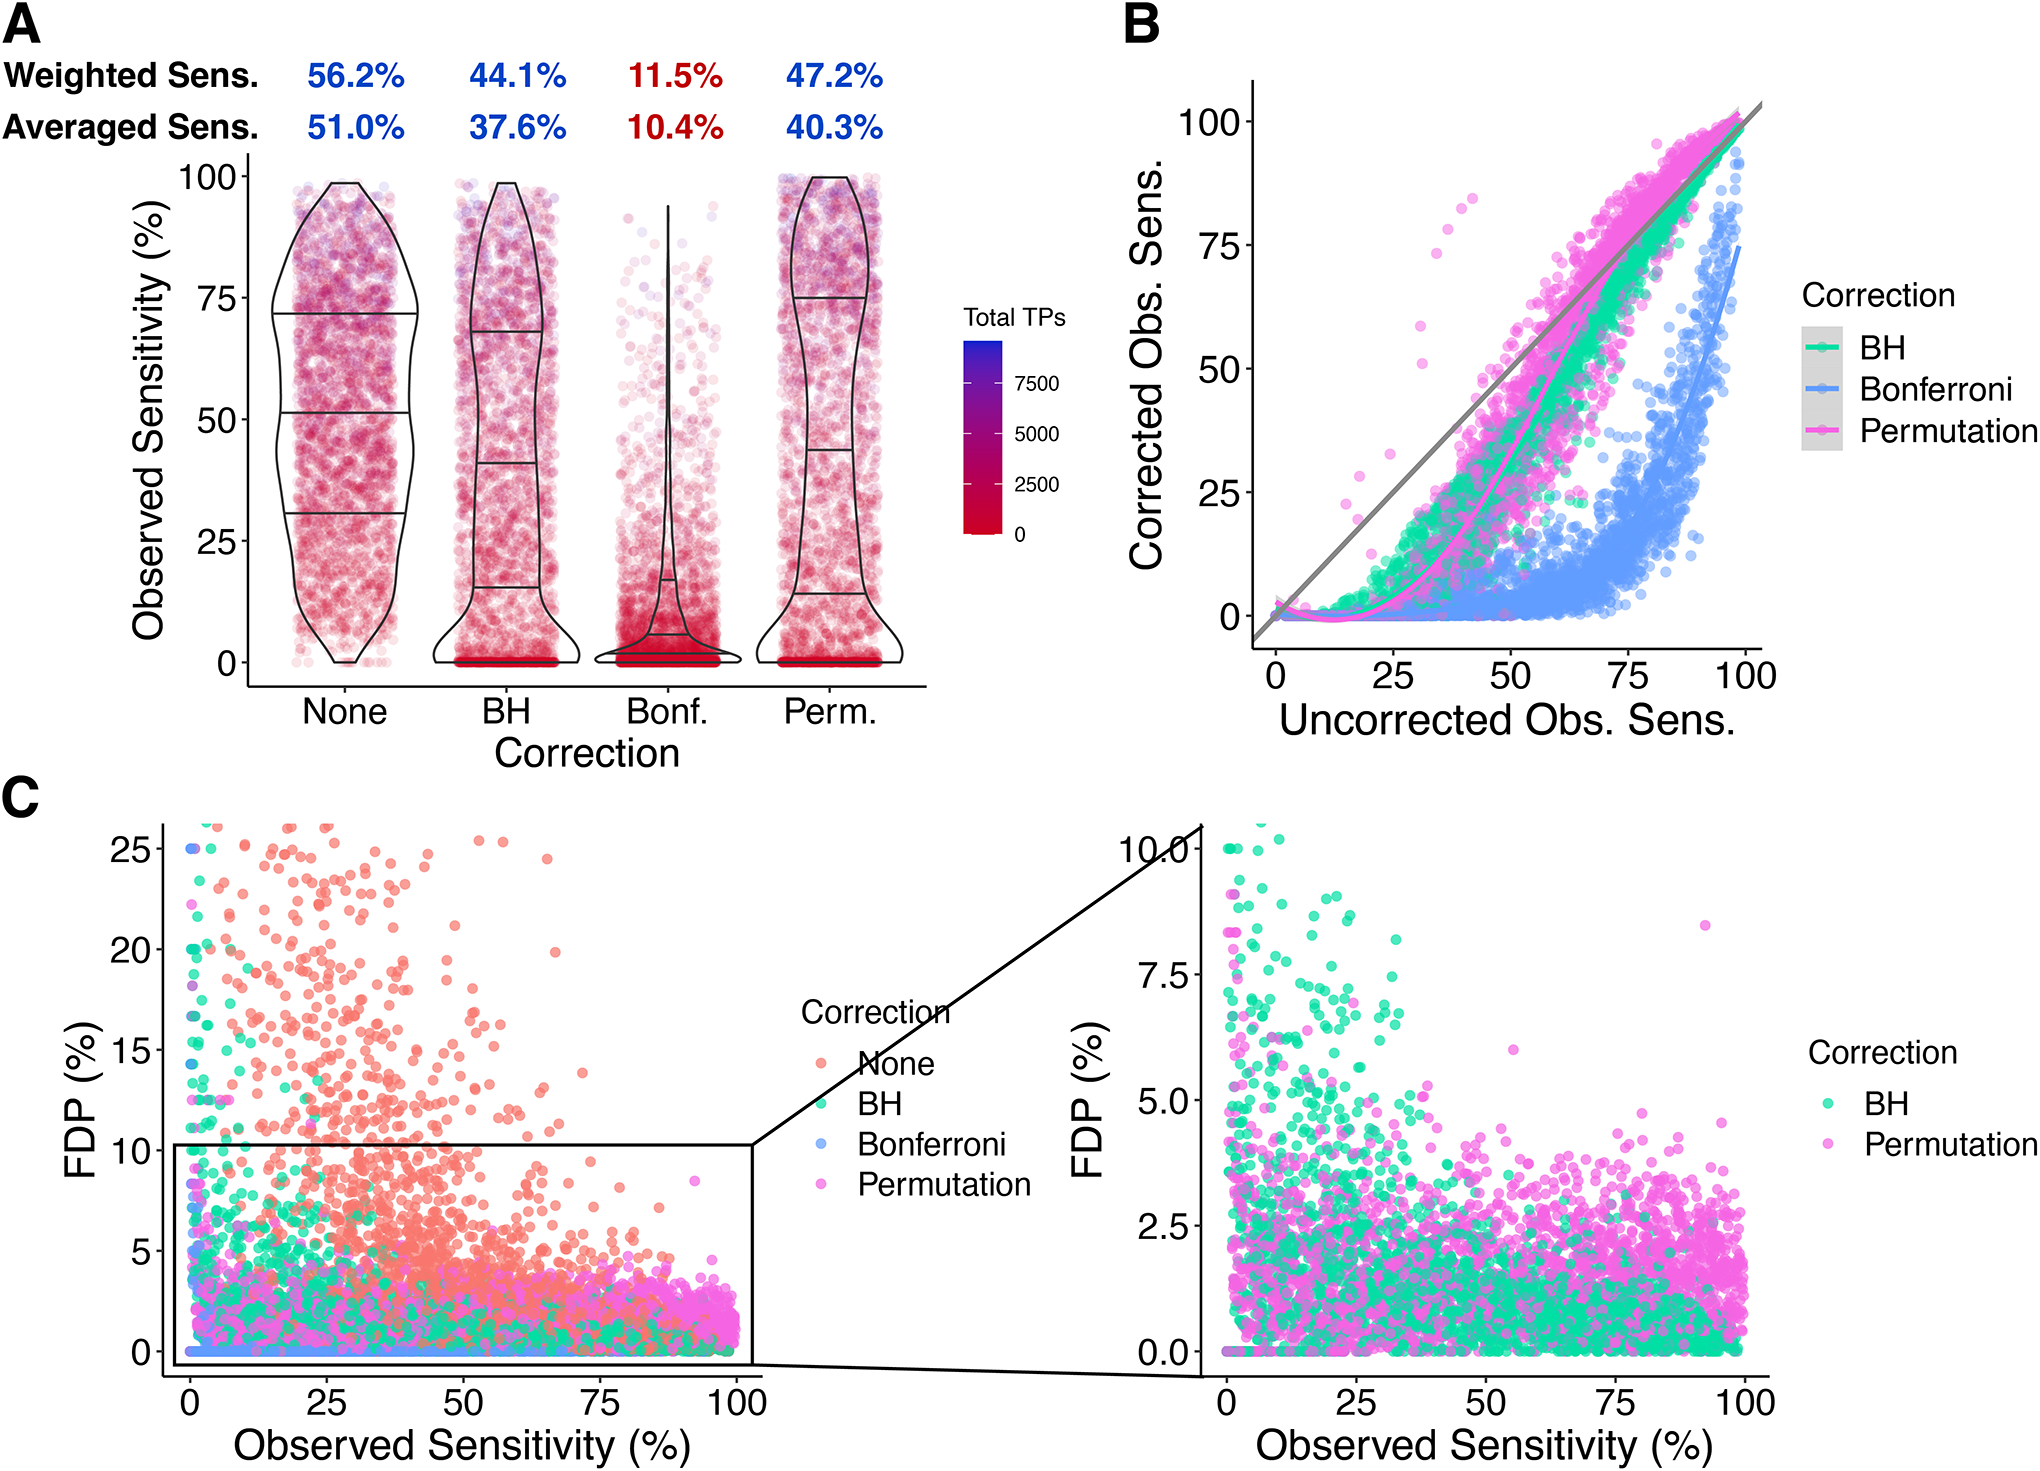
Figure 7. Sensitivity costs of p-value correction with both true and false H0i.

A. Observed Sensitivities and long-run sensitivity estimates. B. Effect of p-value correction on observed sensitivity in each simulation with each method. C. Observed sensitivity vs. FDP.
