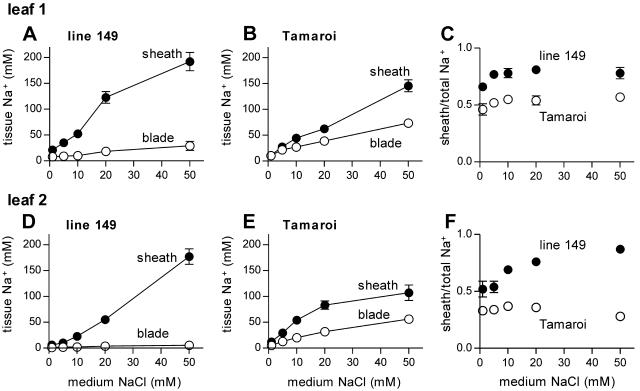
Figure 3.
Na+ content of leaves 1 (A–C) and 2 (D–F) after 5 d exposure to different concentrations of NaCl (all solutions contained half-strength modified Hoagland and CaCl2 to maintain a Na+:Ca2+ ratio below 15:1). A, B, D, and E, Na+ concentrations in the leaf blade (white symbols) and sheath (black symbols). C and F, Ratio of sheath Na+ content to total leaf Na+ (blade + sheath). Data represent mean ± sem (n = 4).

