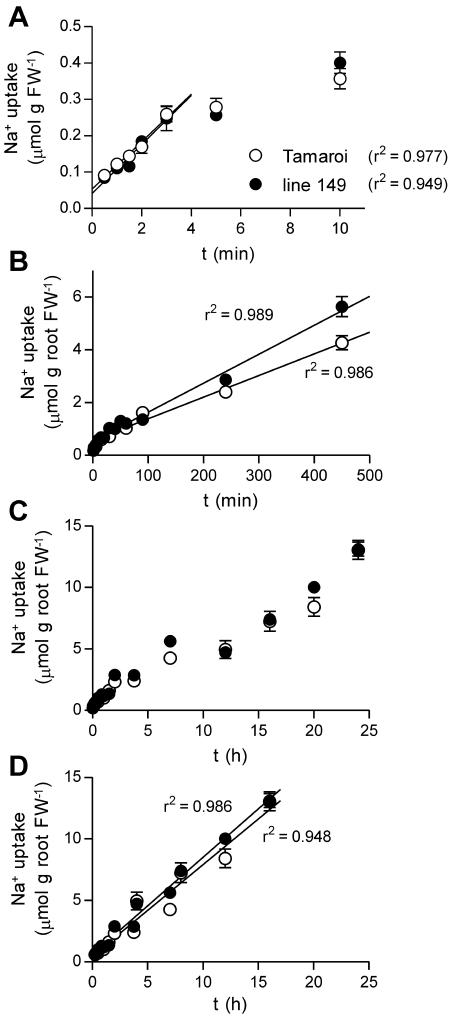
Figure 5.
Root Na+ uptake measured as root 22Na+ accumulation in wheat seedlings pretreated for 5 d in 25 mm NaCl and 2 mm CaCl2 (+ modified half-strength Hoagland). Root uptake measured over 0 to 10 min (A); 15 to 450 min (B); 0.3 to 24 h (C); 0.3 to 24 h with 8-h-dark period subtracted (D). Uptake rates were estimated by fitting linear regressions using least squares method; results are presented in Table II. Black symbols represent salt tolerant line 149; white symbols represent salt sensitive Tamaroi; mean ± sem (n = 4).

