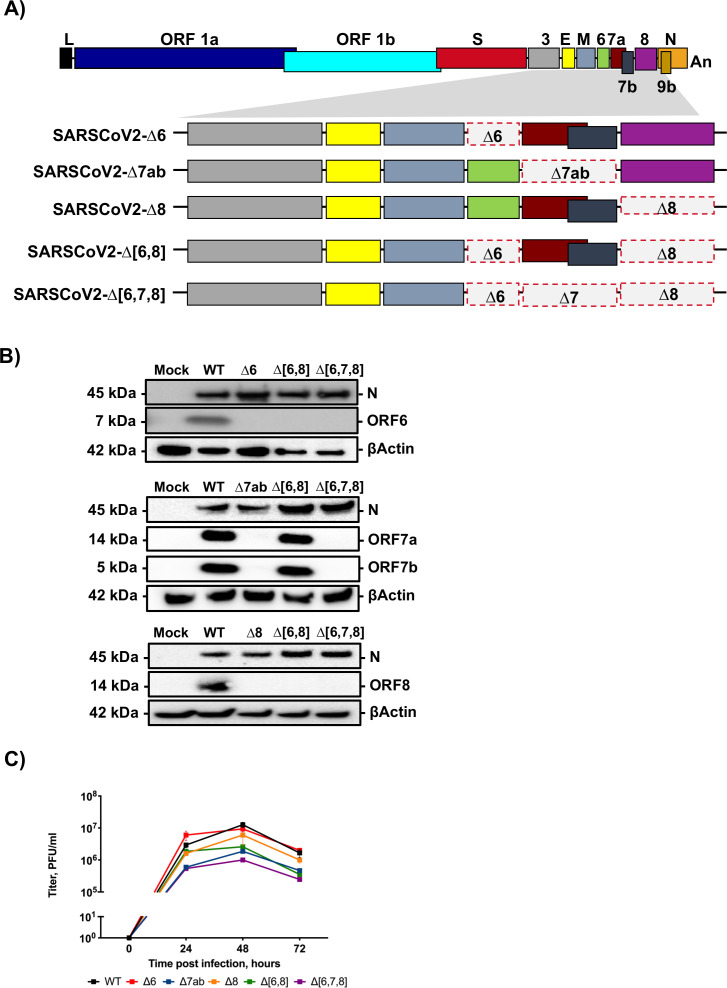
Fig 1.
Generation and characterization of SARS-CoV-2 deletion mutants of accessory genes. (A) Diagram of deletions of accessory genes engineered in each mutant virus. Letters above or below boxes indicate viral genes. L, leader sequence; An, poly-A tail. Red dashed line indicates deleted regions. The shadowed area shows the 3′-end viral genes. (B) Immunoblot analysis of expression of accessory proteins 6, 7a, 7b, and 8 with specific antibodies in lysates from Vero E6 cells infected at an MOI 1 for 24 hours with the indicated mutants. βActin was used as a loading control. (C) Growth kinetics of SARS-CoV-2 deletion mutants. Vero E6/TMPRSS2 cells were infected at an MOI of 0.001, and the infections followed for 72 hours. Results are represented as a mean ± SEM.

