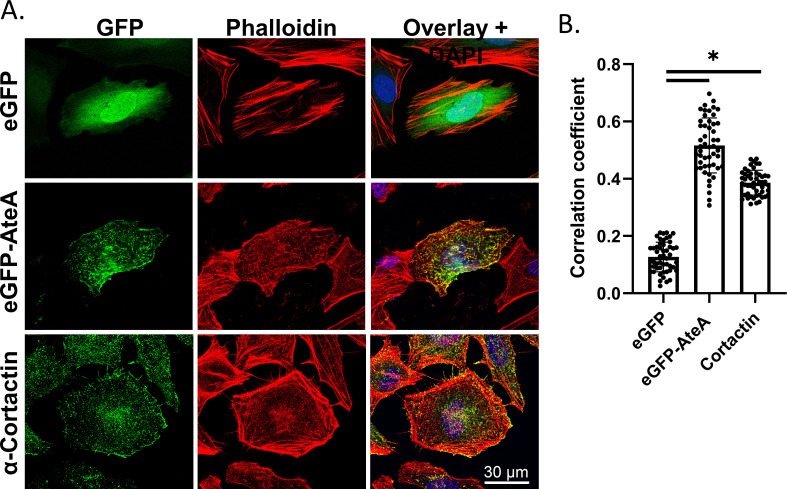
Fig 4.
AteA localization resembling cortical actin. (A) Confocal images of HeLa cells transiently transfected to express eGFP or eGFP-AteA (rows 1 and 2). Cortical actin binding protein visualized using α-cortactin mouse antibody and Alexa Fluor 488 anti-mouse. Actin was stained with Alexa Fluor 564 phalloidin 36 h post transfection. (B) Relative co-localization with phalloidin as measured by Pearson’s correlation (n = 20 cells/group). Compared by one-way ANOVA (*P < 0.05 and ns; not significant).

