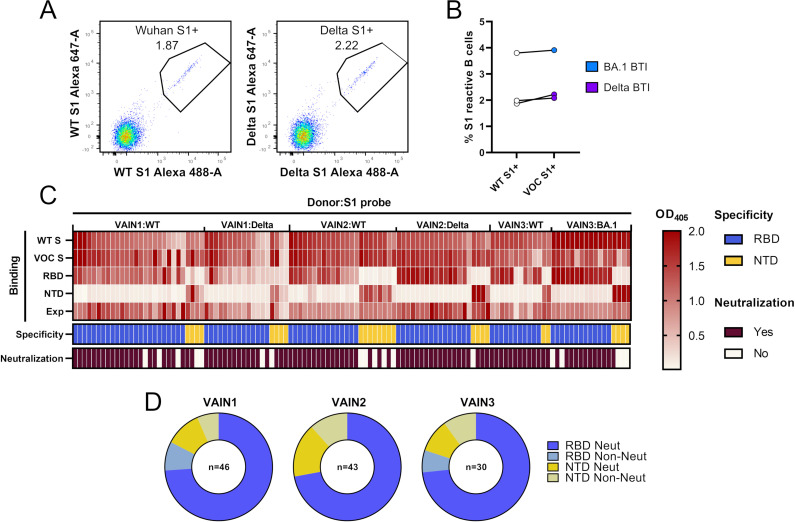
Fig 1.
Isolation of mAbs using antigen-specific B cell sorting. (A) CD14−/CD3−/CD8−/CD19+/IgM−/IgD−/IgG+ and S1+ B cells were sorted into 96-well plates. Example: fluorescent-activated cell sorting showing percentage of CD19+IgG+ B cells binding to S1 of Wuhan-1 or S1 of Delta VOC. Full sorting gating strategy is shown in Fig. S1. (B) Percentage of CD19+IgG+ S1 Wuhan and S1 VOC reactive B cells for each donor (Delta for VAIN1 and VAIN2, BA.1 for VAIN3). Data points from the same individuals are linked. Blue: BA.1/Omicron infected and purple: Delta infected. (C) Heatmap showing IgG expression level and binding to SARS-CoV-2 Spike [WT and VOC (Delta for VAIN1 and VAIN2, BA.1 for VAIN3)], and to Spike domains RBD and NTD. The figure reports optical density (OD) values from a single experiment (range 0–2.0) for undiluted supernatant from small-scale transfection of 119 cloned mAbs. Antigen binding was considered positive when OD at 405 nM was >0.2 after subtraction of the background. SARS-CoV-2 Spike domain specificity (RBD or NTD) for each antibody is indicated. Neutralization activity was measured against wild-type (Wuhan) pseudotyped virus using concentrated supernatant and neutralization status is indicated. Antigen probe used to select specific B cells is indicated (i.e., WT S1, Delta S1, or BA.1 S1). (D) Distribution of mAbs targeting RBD and NTD for each donor, as well as their neutralization capability. mAbs are classified as shown in the key (related to Fig. S1 and S2; Table S1).

