Fig 2.
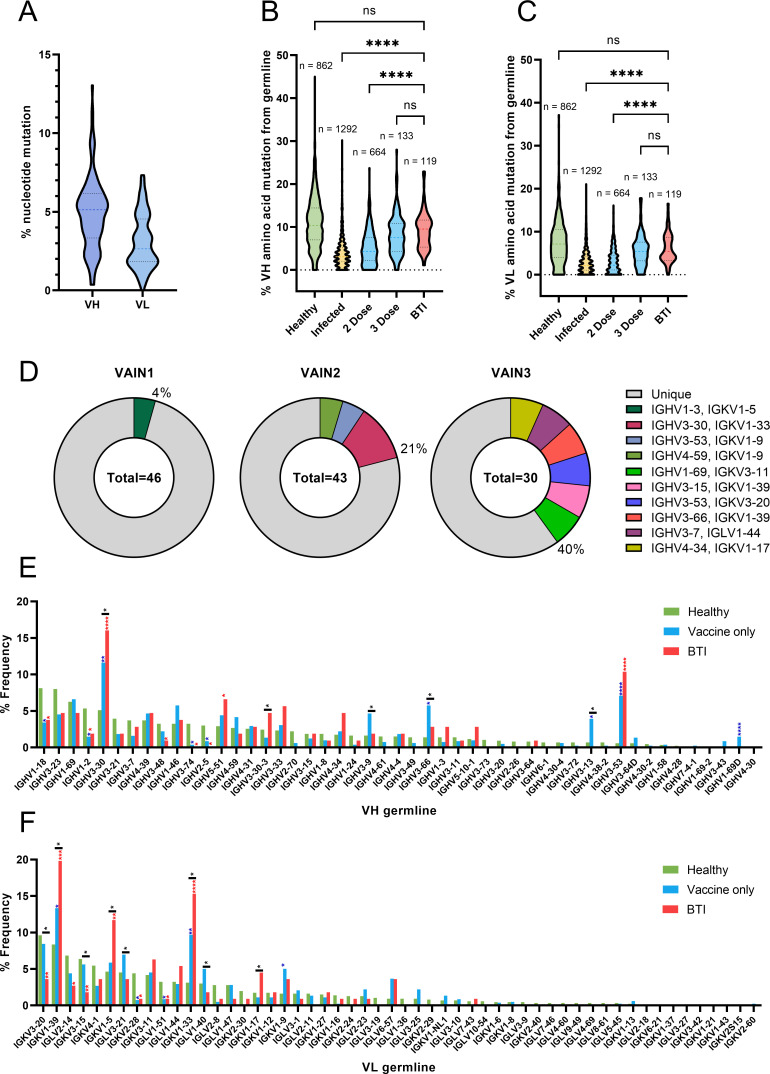
BTI mAbs show higher somatic hypermutation than mAbs isolated following two vaccine doses. (A) Truncated violin plot showing the percentage of nucleotide mutation compared with germline for the VH and VL genes of Spike-reactive mAbs isolated from VAIN1, VAIN2, and VAIN3. Truncated violin plot comparing the percentage of amino acid mutation compared with germline for (B) VH and (C) VL between Spike-reactive mAbs isolated following infection, two doses of vaccine, three doses of vaccine, or following BTI and IgG B cell receptors (BCRs) from SARS-CoV-2-naive individuals (36). D’Agostino and Pearson tests were performed to determine normality. Based on the result, a Kruskal-Wallis test with Dunn’s multiple comparison post hoc test was performed. *P < 0.0332, **P < 0.0021, ***P < 0.0002, and ****P < 0.0001. (D) Pie chart showing the distribution of heavy chain sequences for donors VAIN1, VAIN2, and VAIN3. The number inside the circle represents the number of heavy chains analyzed. The Pie slice size is proportional to the number of clonally related sequences and is color coded based on clonal expansions described in Table S2. The percentage (%) on the outside of the Pie slice represents the overall % of sequences related to a clonal expansion. Graph showing the relative abundance of (E) V H and (F) V L gene usage for Spike-reactive mAbs isolated following infection (n = 1,292), vaccination (n = 817, including two and three vaccine doses) or following BTI (n = 106), and IgG BCRs from SARS-CoV-2-naive individuals (n = 1,292) (36). Statistical significance was determined by binomial test. *P ≤ 0.05, **P ≤ 0.01, ***P ≤ 0.001, and ****P ≤ 0.0001. Blue stars represent vaccine vs healthy, red stars represent BTI vs healthy, and black stars represent BTI vs vaccine (related to Fig. S3; Table S2).

