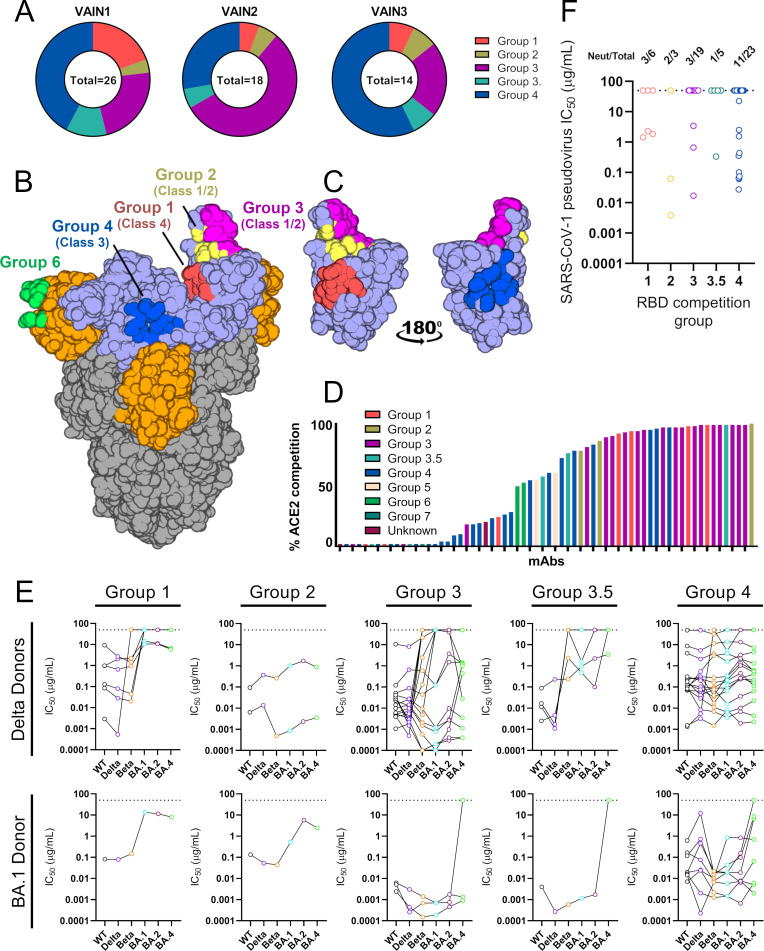
Fig 4.
RBD mAb characterization. (A) Pie chart showing distribution of RBD-specific mAbs between competition groups for VAIN1, VAIN2, and VAIN3. (B) Surface representation of SARS-CoV-2 WT spike (pdb:6XM0) showing epitopes of previously characterized competition groups as colored surfaces (6). RBD competition groups are also shown as RBD classes as defined by Barnes et al. (40). RBD and NTD are indicated by light blue and orange, respectively. (C) Surface representation of RBD domain in the up conformation showing location and proximity of Group 1 (red), Group 2 (yellow), Group 3 (magenta), and Group 4 (blue). Structures were generated in Pymol. (D) Ability of RBD-specific neutralizing antibodies to inhibit the interaction between cell surface ACE2 and soluble SARS-CoV-2 Spike. mAbs (at 600 nM) were pre-incubated with fluorescently labeled Spike before addition to HeLa-ACE2 cells. The percentage reduction in mean fluorescence intensity is reported. Experiments were performed in duplicate. Bars are color coded based on their competition group. (E) Neutralization breadth and potency of RBD-specific mAbs within the different RBD competition groups. mAbs are separated by the infecting VOC. Data for each mAb are linked. Dotted line represents the highest concentration of antibody tested. (F) Neutralization potency of RBD-specific mAbs against SARS-CoV-1. Data are presented by RBD competition group (related to Fig. S4 through S6).

