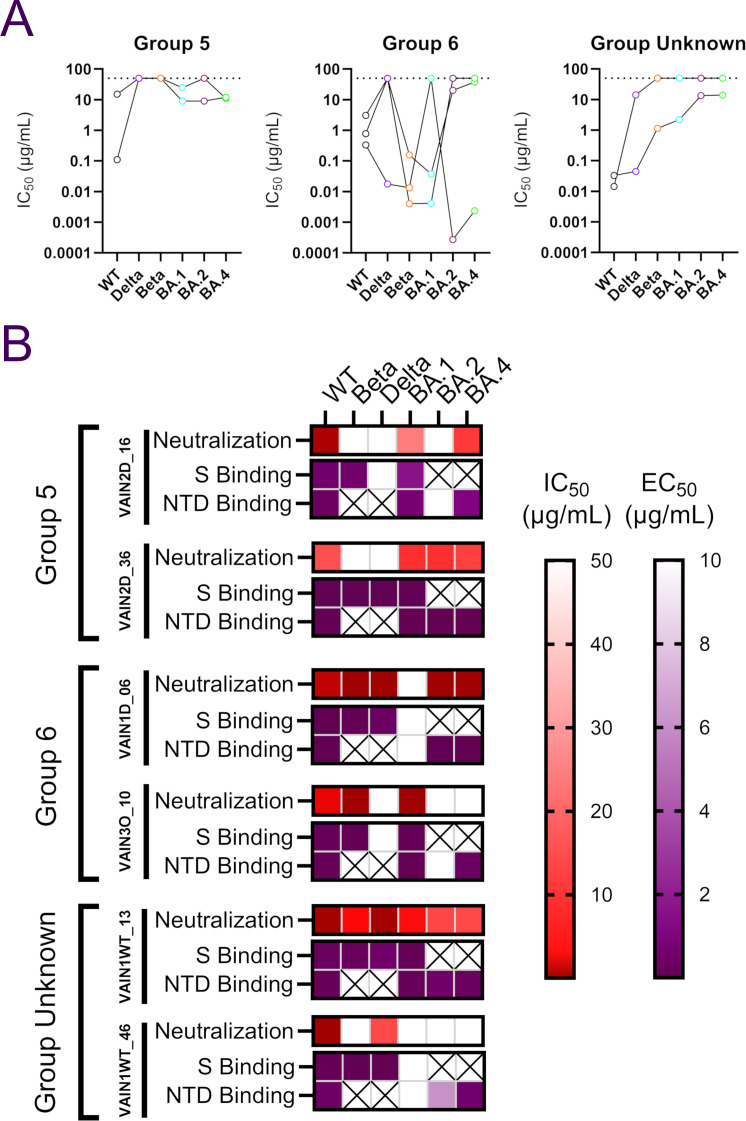
Fig 5.
NTD mAb characterization. (A) Neutralization breadth and potency of NTD-specific mAbs within the different NTD competition groups. Data for each mAb are linked. Dotted line represents the highest concentration of antibody tested. (B) Comparison between neutralization activity (IC50) and binding to Spike or NTD (EC50) by ELISA for NTD-specific mAbs. IC50 and EC50 (half-maximal effective concentrations of binding) values are shown as a heat map for each NTD-specific mAb with the level of binding shown in the key. A cross indicates that the Spike or NTD antigen for that variant was not available to test (related to Fig. S5).

