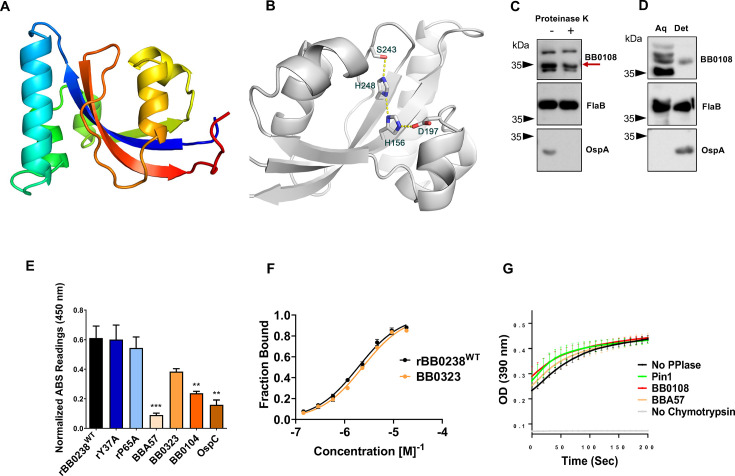
Fig 5.
Crystal structure and characterization of BB0108. (A) The crystal structure of the PPIase domain shown with the rainbow color, as in Fig. 4B. (B) The active site of the BB0108 PPIase domain showing the hydrogen bond network within the catalytic machinery. The side chains are shown in stick models with the atomic colors (carbon—gray, oxygen—red, nitrogen—blue). Electrostatic interactions are shown in yellow dotted lines. (C) BB0108 reflects limited cell surface exposure. Proteinase K assays were performed on wild-type spirochete cultures, which were either treated with (+) or without enzyme (−). Protein levels for BB0108, FlaB, and OspA were determined via the respective serums. (D) BB0108 primarily exists as a soluble protein. Lysates from wild-type spirochetes were partitioned into aqueous (aq) and detergent (det) phases. Protein levels for BB0108, FlaB, and OspA were determined via respective antibodies. (E) BB0108-BB0238 interactions examined by microtiter assay. Wells were coated with 1 μg of recombinant rBB0238WT, rY37A, rP65A, BBA57, BB0323, BB0104 (BbHtrA), and OspC (control). Plates were incubated with 1 μg of BB0108 and detected via BB0108 antibody. The data are representative of three separate experiments, each with three technical replicates, and presented after background signal was subtracted. ***P < 0.001; **P < 0.01. (F) BB0108-BB0238 interactions examined by microscale thermophoresis assay. MST analysis depicting the titration of BB0108 binding to fluorescently labeled rBB0238WT or BB0323 is presented; KD values are 1.8930 ± 0.2368 µM and 2.3293 ± 0.3962 µM, respectively. (G) BB0108 reflects PPIase activity. Enzymatic coupled assay demonstrates PPIase cis/trans isomerization through the chymotrypsin-dependent cleavage of succinyl-Ala-Phe-Pro-Phe-4-nitroanilide, resulting in a color signal read at 390 nm. Readings were taken every 10 seconds over 15 minutes. The background reaction without PPIase enzyme (black), positive control using a known PPIase, Pin1 (green), BB0108 (red), the integral membrane protein BBA57 (orange), and a negative control without chymotrypsin (gray) are shown. Each dot represents the average of four individual assays, with each group performed in duplicate wells; errors bars represent the standard error of mean (SEM).

