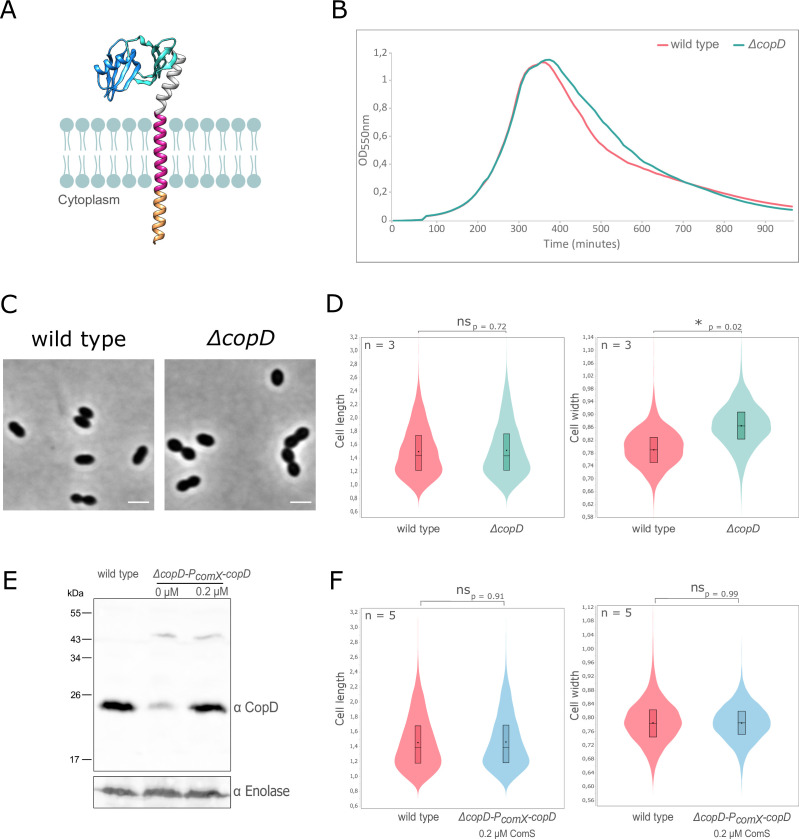
Fig 1.
CopD and cell morphology and growth. (A) Schematic model for CopD. The two PEPSY domains were modeled using Alphafold (https://alphafold.com/entry/Q8DP25) and are adapted from published structural information of PEPSY-domains (PDB ID 5BOI). The predicted transmembrane domain and the short cytoplasmic domain (16 amino acids) are shown as red and orange α-helices, respectively. The two PEPSY domains are shown in dark and light blue. (B) Growth of WT and ∆copD strains. Strains were grown in C + Y medium at 37°C in a spectrophotometer. The OD550 was read automatically every 10 minutes. (C) Representative phase contrast microscopy images of WT and ∆copD cells. Scale bar, 2 µm. (D) Violin plot showing the distribution of the cell length (left panel) and cell width (right panel) for WT and ∆copD strains as determined using MicrobeJ (31). The distribution of the cell length and width are shown in red for the WT strain and in blue for the ∆copD strain. Statistical comparison was done using t-test. *P < 0.05. n = 3 indicates the number of independent experiments with a total of 5,000 cells analyzed. (E) Western immunoblot of whole-cell lysates from WT and ∆copD-PcomX-copD cells, grown to exponential phase in the presence (0.2 µM) or absence of the ComS inducer, were probed with anti-CopD antibody. To estimate the relative quantity of proteins in crude extract and to compare the different lanes, we used the enolase (Spr1036) as an internal standard. The enolase was detected using specific antibodies (α Enolase) and is presented in the lower part of the Figure. (F) Violin plot showing the distribution of the cell width for WT and ∆copD-PcomX-copD strains as determined using MicrobeJ (31). The distribution of the cell length (left panel) and cell width (right panel) is shown in red for the WT strain and in blue for the ∆copD-PcomX-copD strain. Statistical comparison was done using t-test. n = 5 indicates the number of independent experiments with a total of 10,000 cells analyzed. For panels D and F, the box indicates the 25th to the 75th percentile, and the whiskers indicate the minimum and the maximum values. The mean and the median are indicated with a dot and a line in the box, respectively.

