Fig 2.
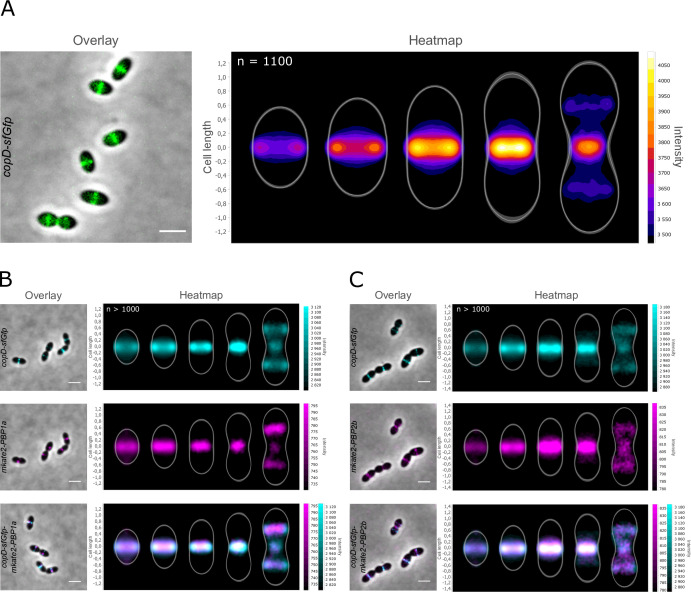
Localization of CopD-sfGFP, mKate2-PBP1a, and mkate2-PBP2b. (A) Overlays (left panel) between phase-contrast and GFP images of CopD-sfGFP cells. Scale bar, 2 µm. The heatmap (right panel) represents the localization patterns of CopD-sfGFP during the cell cycle. (B) and (C) co-localization of CopD-sfGFP and either mkate2-PBP1a (B) or mkate2-PBP2b (C) in WT cells. Overlays between phase contrast and GFP and mKate2 images are shown on the left while corresponding heatmaps representing the two-dimensional localization patterns during the cell cycle are shown on the right. Scale bar, 2 µm. The n values represent the number of cells analyzed in a single representative experiment. Experiments were performed in triplicate.

